Let’s go back to the basics. What is web analytics?
Do you already know about it? Think harder!
Are you going to learn what web analytics is, why it’s important, what it includes, and how to do it—all in one article?
Yes! We promise you will.
Without splitting it into Web Analytics 1, 2, or endless parts (You know who does this? Spoiler alert: It’s not Heap)
And without dragging it out with 4,000 words (Disclaimer: no Userpilot will be harmed)
We’ll make it simple and clear.
Let’s get started!
What is web analytics?
Web analytics is the process of collecting, measuring, analyzing, and reporting website data to understand and optimize web usage. It’s like having a high-tech system for your website, providing you with valuable insights into your visitors’ behavior, preferences, and interactions.
For instance, imagine you run an e-commerce store. Web analytics can tell you:
- Which products are getting the most views?
- How long do people spend browsing different categories?
- At what point in the checkout process might customers abandon their carts?
- Which marketing campaigns are driving the most valuable traffic?
This information is invaluable for making data-driven decisions to improve your website and boost sales.
Web analytics data is typically collected by placing a tracking snippet on your website. This snippet of code allows a web analytics platform to track various aspects of visitor behavior, including:
- Pages viewed (commonly referred to as page views)
- Button clicks
- Form submissions
- Time spent on site
- Traffic sources
- And much more
By collecting and analyzing this data, web analytics tools can infer insights such as:
- The number of users who visited your website in any given time period
- Engagement rates
- Time spent on pages
- Conversion rates
- User journeys through your sites
Pretty simple, right? Come along to know why all this matters.
Why is web analytics important?
Understanding your website’s performance through analytics is crucial for several reasons:
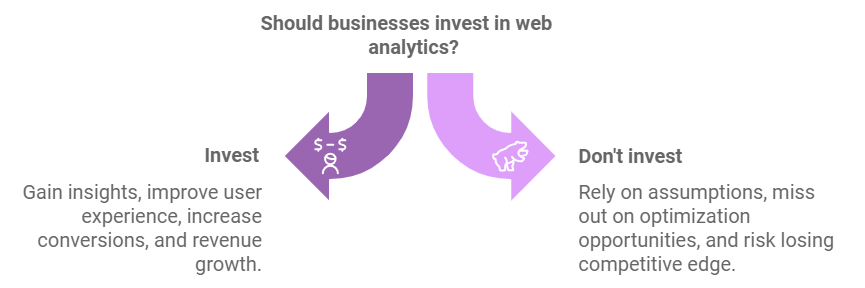
- Informed decision-making: Web analytics provides concrete data to back up your business decisions. Instead of relying on gut feelings or assumptions, you can make choices based on real user behavior.
- Improved user experience: By understanding how visitors interact with your site, you can identify pain points and optimize the user experience, leading to higher satisfaction and retention rates.
- Increased conversions: Analytics help you identify which elements of your site are most effective at converting visitors into customers, allowing you to replicate success across your platform.
- Efficient marketing: By tracking the performance of different marketing channels, you can allocate your budget more effectively, focusing on strategies that deliver the best return on investment.
- Competitive edge: In-depth analytics give you insights into market trends and user preferences, helping you stay ahead of the competition.
- Personalization opportunities: With detailed user data, you can tailor content and offers to specific segments of your audience, enhancing engagement and loyalty.
- Revenue growth: By optimizing based on analytics insights, you can improve your website’s performance, leading to increased sales and revenue.
- Customer retention: Understanding user behavior helps create better retention strategies, reduce churn, and increase customer lifetime value.
Now you know why it is important. Let’s move ahead!
The most important web analytics metrics
To harness the power of web analytics, it’s crucial to understand the key metrics that provide actionable insights. Let’s explore these in detail:
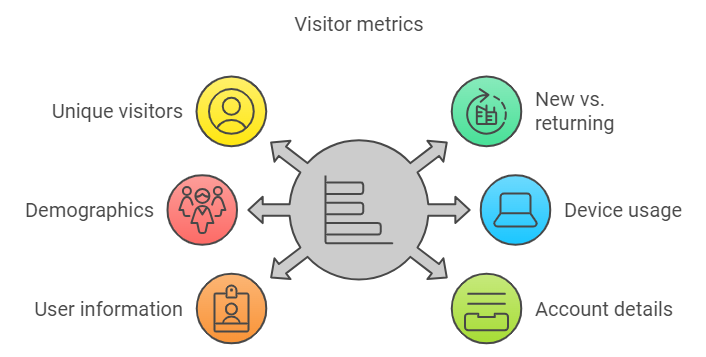
1. Visitor data
Visitor data refers to information collected about the people engaging with your website or web app. Core data points include:
- Unique visitors: The number of distinct individuals visiting your site.
- New vs. returning visitors: The ratio of first-time visitors to those who have been to your site before.
- Demographics: Age, gender, location, and other characteristics of your visitors.
- Devices and browsers: What technology your visitors are using to access your site.
- Individual user information: Name, email, company, etc. (for logged-in users or customers).
- Account information: Prospect, leads, paying customers, plan types, etc.
- Custom usage metrics: Total payments made, items purchased, downloads/uploads, most used features, etc.
Understanding your visitor data helps create targeted marketing campaigns and personalize user experiences.
2. Visitor behavior
Visitor behavior metrics provide insights into how users interact with your website:
- Pageviews: The total number of pages viewed on your site.
- Time on page: How long visitors spend on each page.
- Bounce rate: The percentage of visitors who leave after viewing only one page.
- Exit pages: These are the last pages visitors view before leaving your site.
- Feature usage: Interactions with specific features of your product or service.
- Visit duration: The duration of time a visitor spends engaging with your web property before leaving.
- Referrer data: Information on how your visitors came to your site (e.g., direct traffic, search, PPC, marketing campaigns).
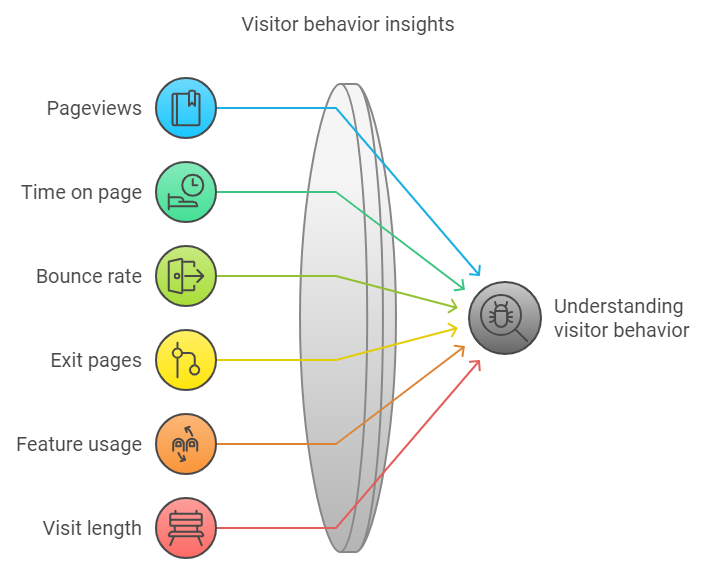
These metrics help you understand what content resonates with your audience and where you might be losing their interest.
3. Conversion rate & event tracking
Conversion and event tracking are crucial for measuring the effectiveness of your website in achieving business goals:
- Conversion rate: The percentage of visitors who complete a desired action (e.g., making a purchase, signing up for a newsletter).
- Goal completions: The number of times visitors complete specific goals you’ve set.
- Event tracking: Monitoring specific interactions like button clicks, video plays, or form submissions.
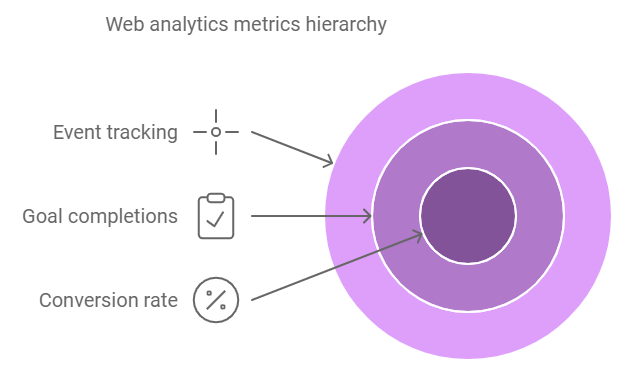
These metrics help you identify which aspects of your site are performing well and which need improvement to drive more conversions.
4. Funnel analysis
Funnel analysis helps you understand the customer journey through your conversion process:
- Conversion funnel: Visualize the steps visitors take toward a conversion.
- Drop-off points: Identify where visitors are leaving in the funnel.
- Funnel conversion rate: The percentage of visitors who complete the entire funnel.
By analyzing your funnels, you can identify bottlenecks in your conversion process and optimize each stage for better performance.
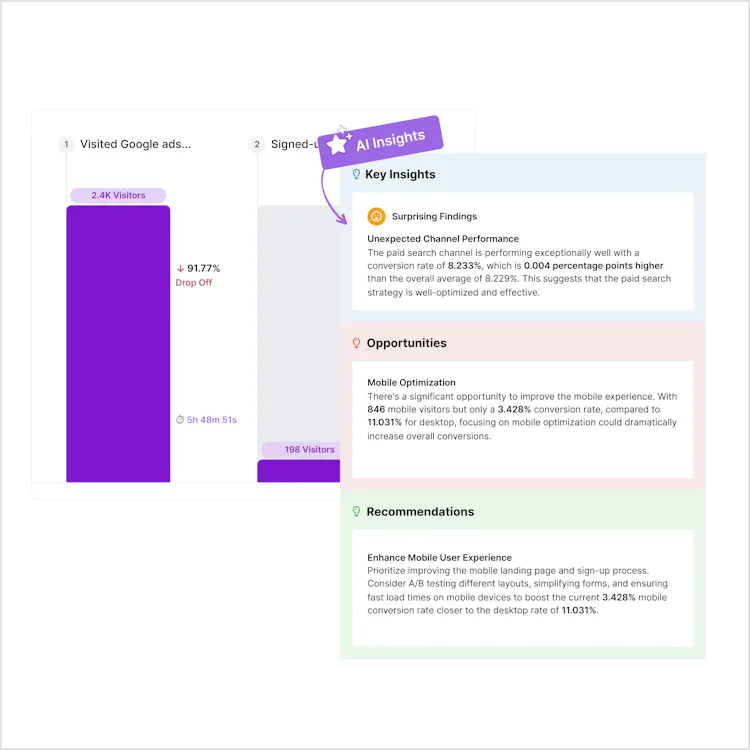
Usermaven takes funnel analysis to the next level with AI-powered insights and suggestions. The platform’s advanced algorithms analyze your funnel data to:
- Automatically identify significant drop-off points
- Provide AI-generated suggestions for improving conversion rates at each stage
- Highlight unusual patterns or anomalies that might require attention
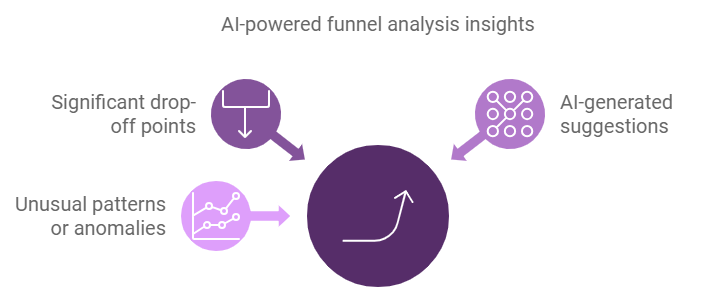
These AI-driven insights allow you to make data-informed decisions quickly without spending hours manually analyzing funnel data.
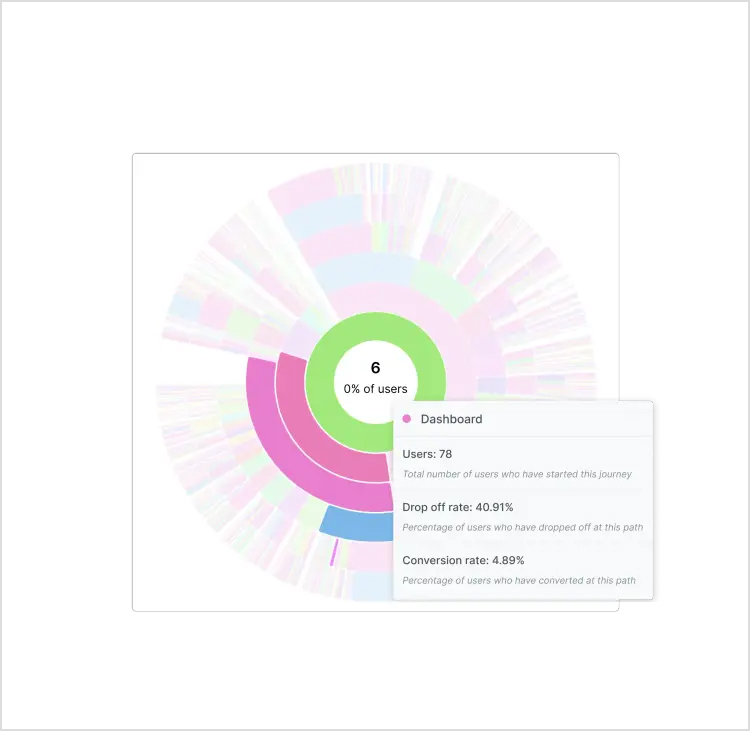
5. Customer journey
Understanding the customer journey provides insights into how users navigate your site:
- User flow: The paths visitors typically take through your site.
- Entry points: The pages where visitors first land on your site.
- Navigation summary: How visitors move from one page to another.
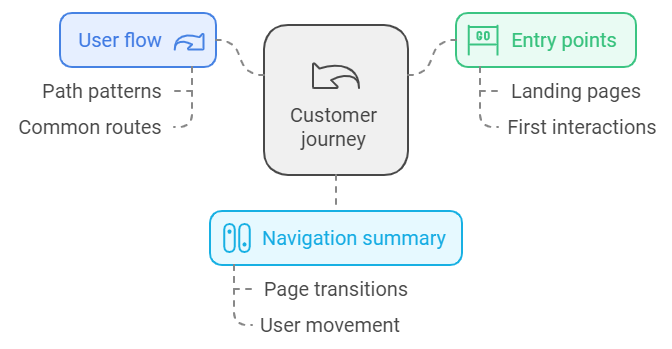
This information helps you optimize your site structure and content to guide users toward your desired actions.
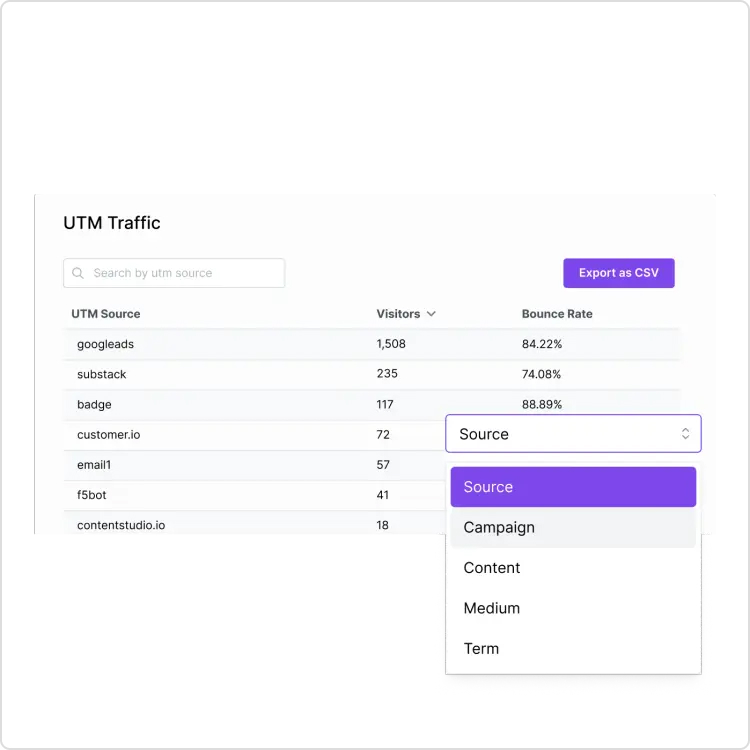
6. Marketing campaign analysis
Tracking the performance of your marketing efforts is crucial for optimizing your ROI:
- Traffic sources: Where your visitors are coming from (e.g., search engines, social media, direct).
- Campaign performance: How well different marketing initiatives are driving traffic and conversions.
- UTM parameters: Tracking the effectiveness of specific links and campaigns.
These metrics help you understand which marketing channels and campaigns are most effective, allowing you to allocate your resources more efficiently.
Web analytics examples
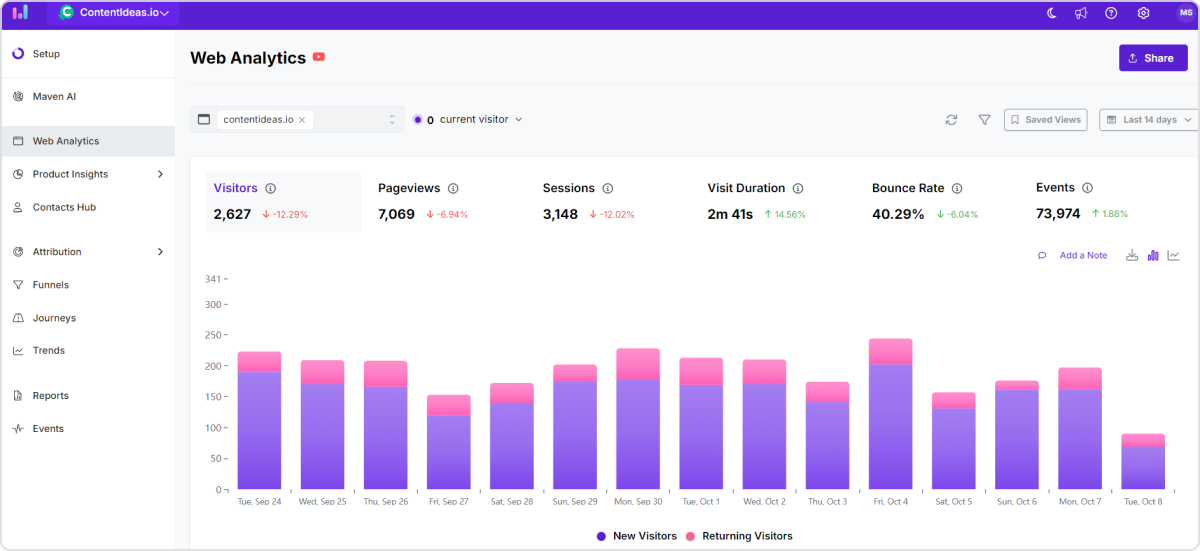
Let’s examine some real-world scenarios (just examples of how you can utilize these tools in a number of other ways) using Usermaven’s comprehensive dashboard to illustrate how web analytics can drive business decisions:
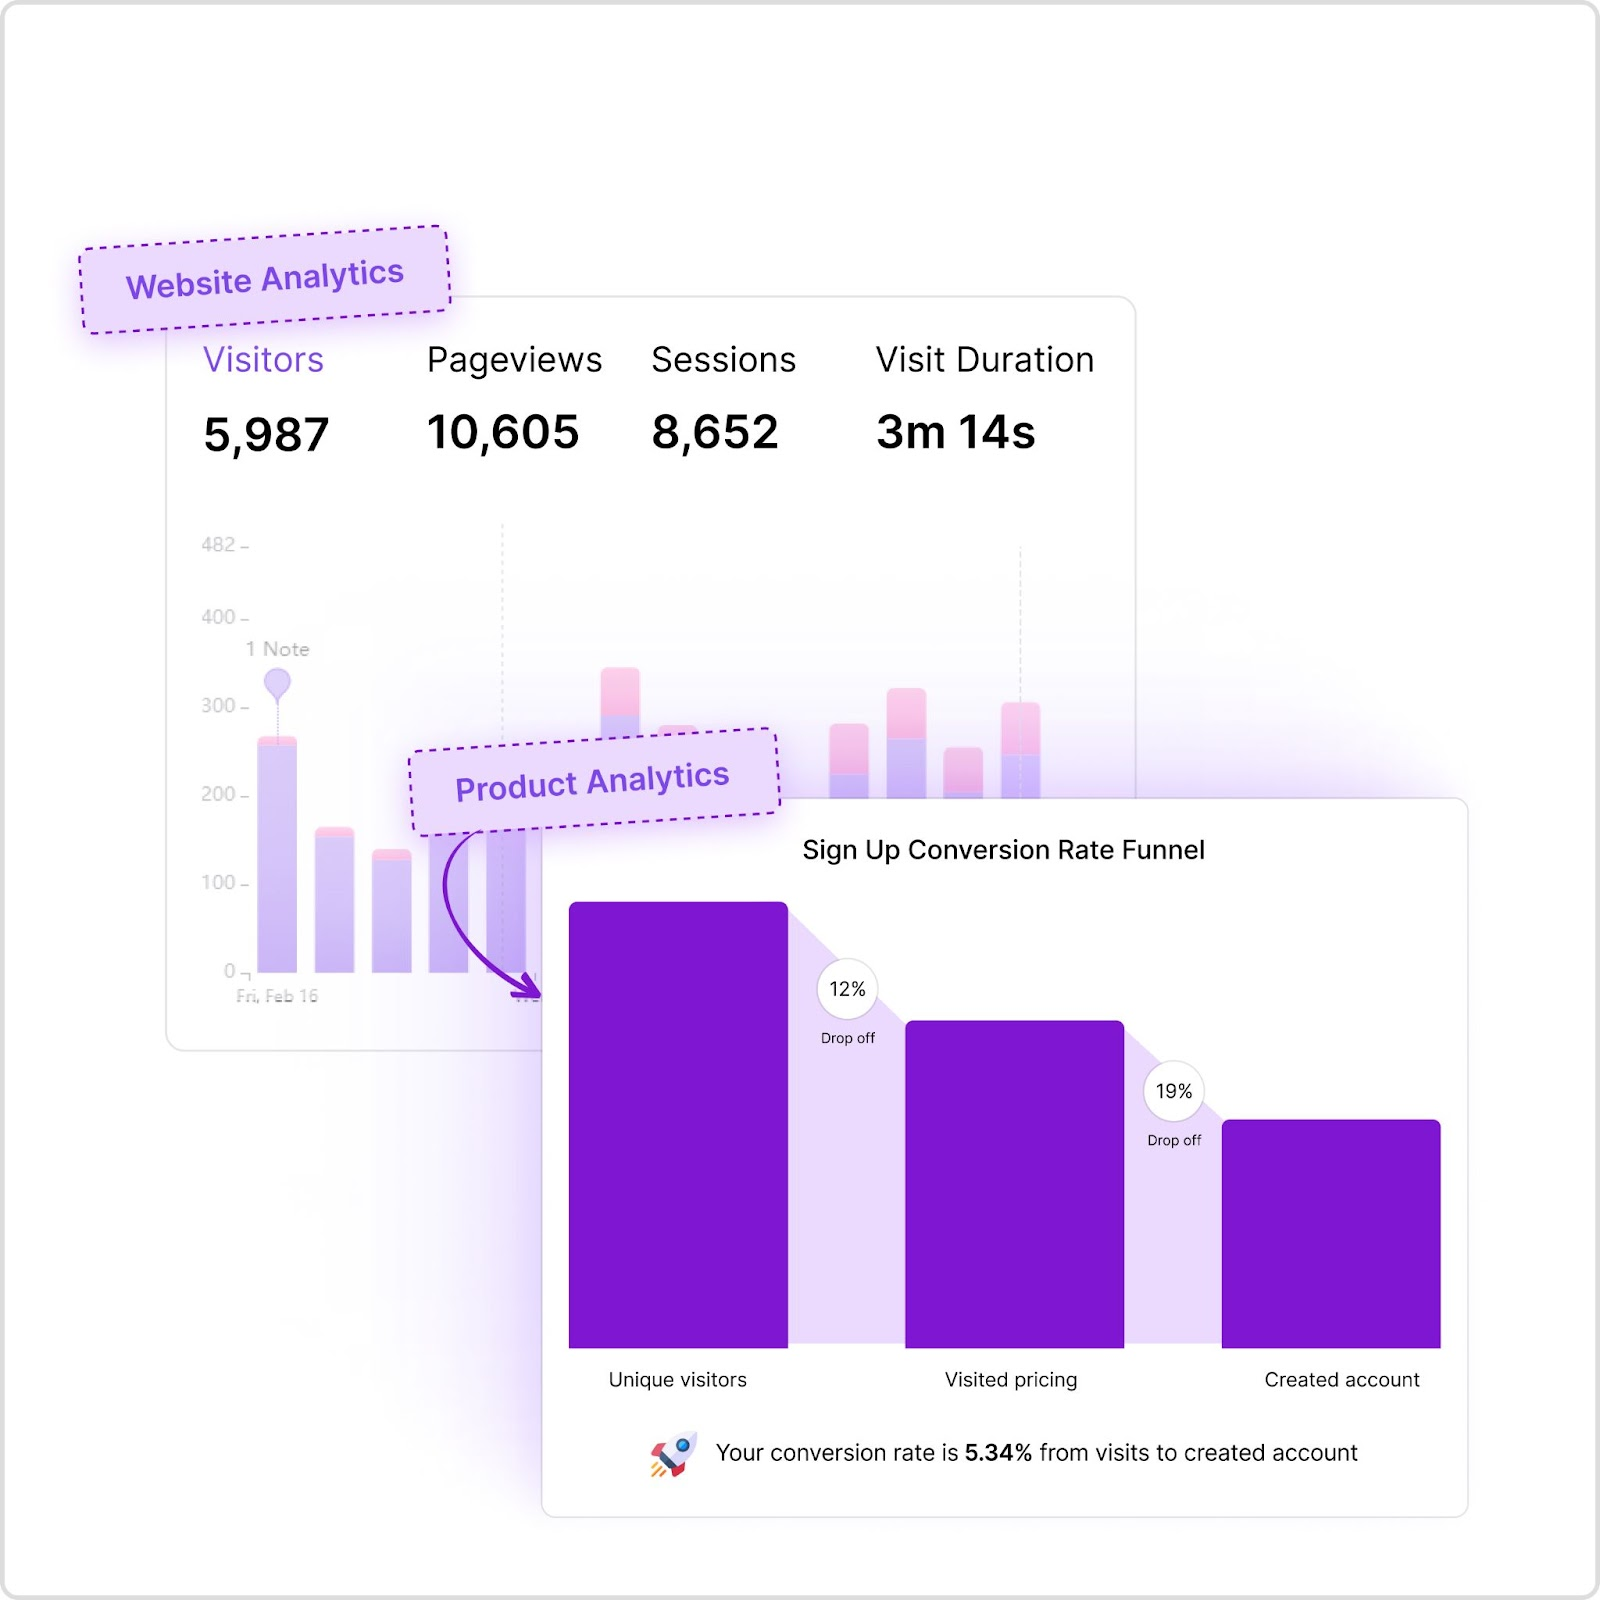
- Visitor data analysis: Usermaven’s dashboard provides a clear overview of your website’s visitor data. For instance, you might notice a spike in mobile users from a specific geographic region over the past week. This could indicate the success of a recent mobile-targeted campaign in that area, prompting you to allocate more resources to similar campaigns.
- Behavior flow insights: Usermaven’s journey analysis feature reveals the path users take after signing up for your SaaS product. The dashboard shows that 70% of users who complete the onboarding tutorial within 24 hours of signing up are more likely to become paying customers.
However, only 40% of new sign-ups complete the tutorial. Of those who don’t complete the tutorial, 60% drop off after exploring just one feature. This insight prompts you to redesign your onboarding process, making the tutorial more engaging and showcasing key features earlier. After implementation, tutorial completion rates increase to 65%, and overall conversion to paid accounts rises by 25%.
- Conversion funnel optimization: Usermaven’s funnel analysis tool shows a significant drop-off between adding items to the cart and completing the checkout process. The AI-powered insights suggest that simplifying the checkout form could reduce abandonment rates. After implementing this change, you will see a 20% increase in completed purchases.
- Campaign performance tracking: Using UTM parameters, you notice through Usermaven that your recent email campaign is driving high-quality traffic with a conversion rate double that of other sources. This insight leads you to invest more in email marketing, resulting in a 30% increase in overall conversions.
- Event tracking and feature adoption: Usermaven’s event tracking capabilities allow you to monitor specific user interactions on your website. For example, you set up event tracking for key actions like “Clicked Sign Up Button,” “Watched Product Demo,” and “Added to Cart.” The data reveals that users who watch the product demo have a 70% higher chance of adding items to their cart compared to those who don’t.
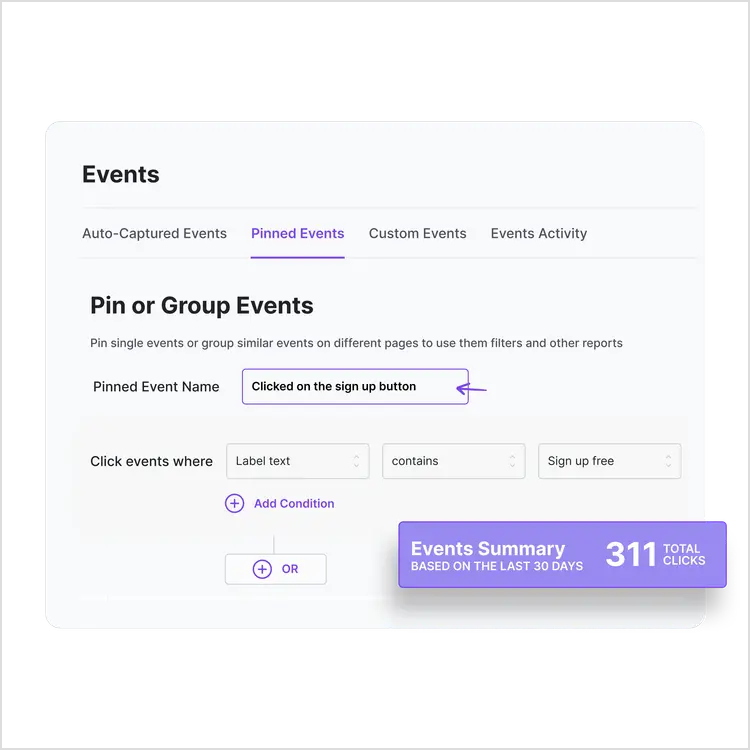
However, only 20% of visitors are clicking on the demo video. Based on this insight, you decide to make the demo more prominent and add an autoplay feature. After implementation, demo views increase by 50%, leading to a 35% boost in “Add to Cart” actions and a subsequent rise in overall conversions.
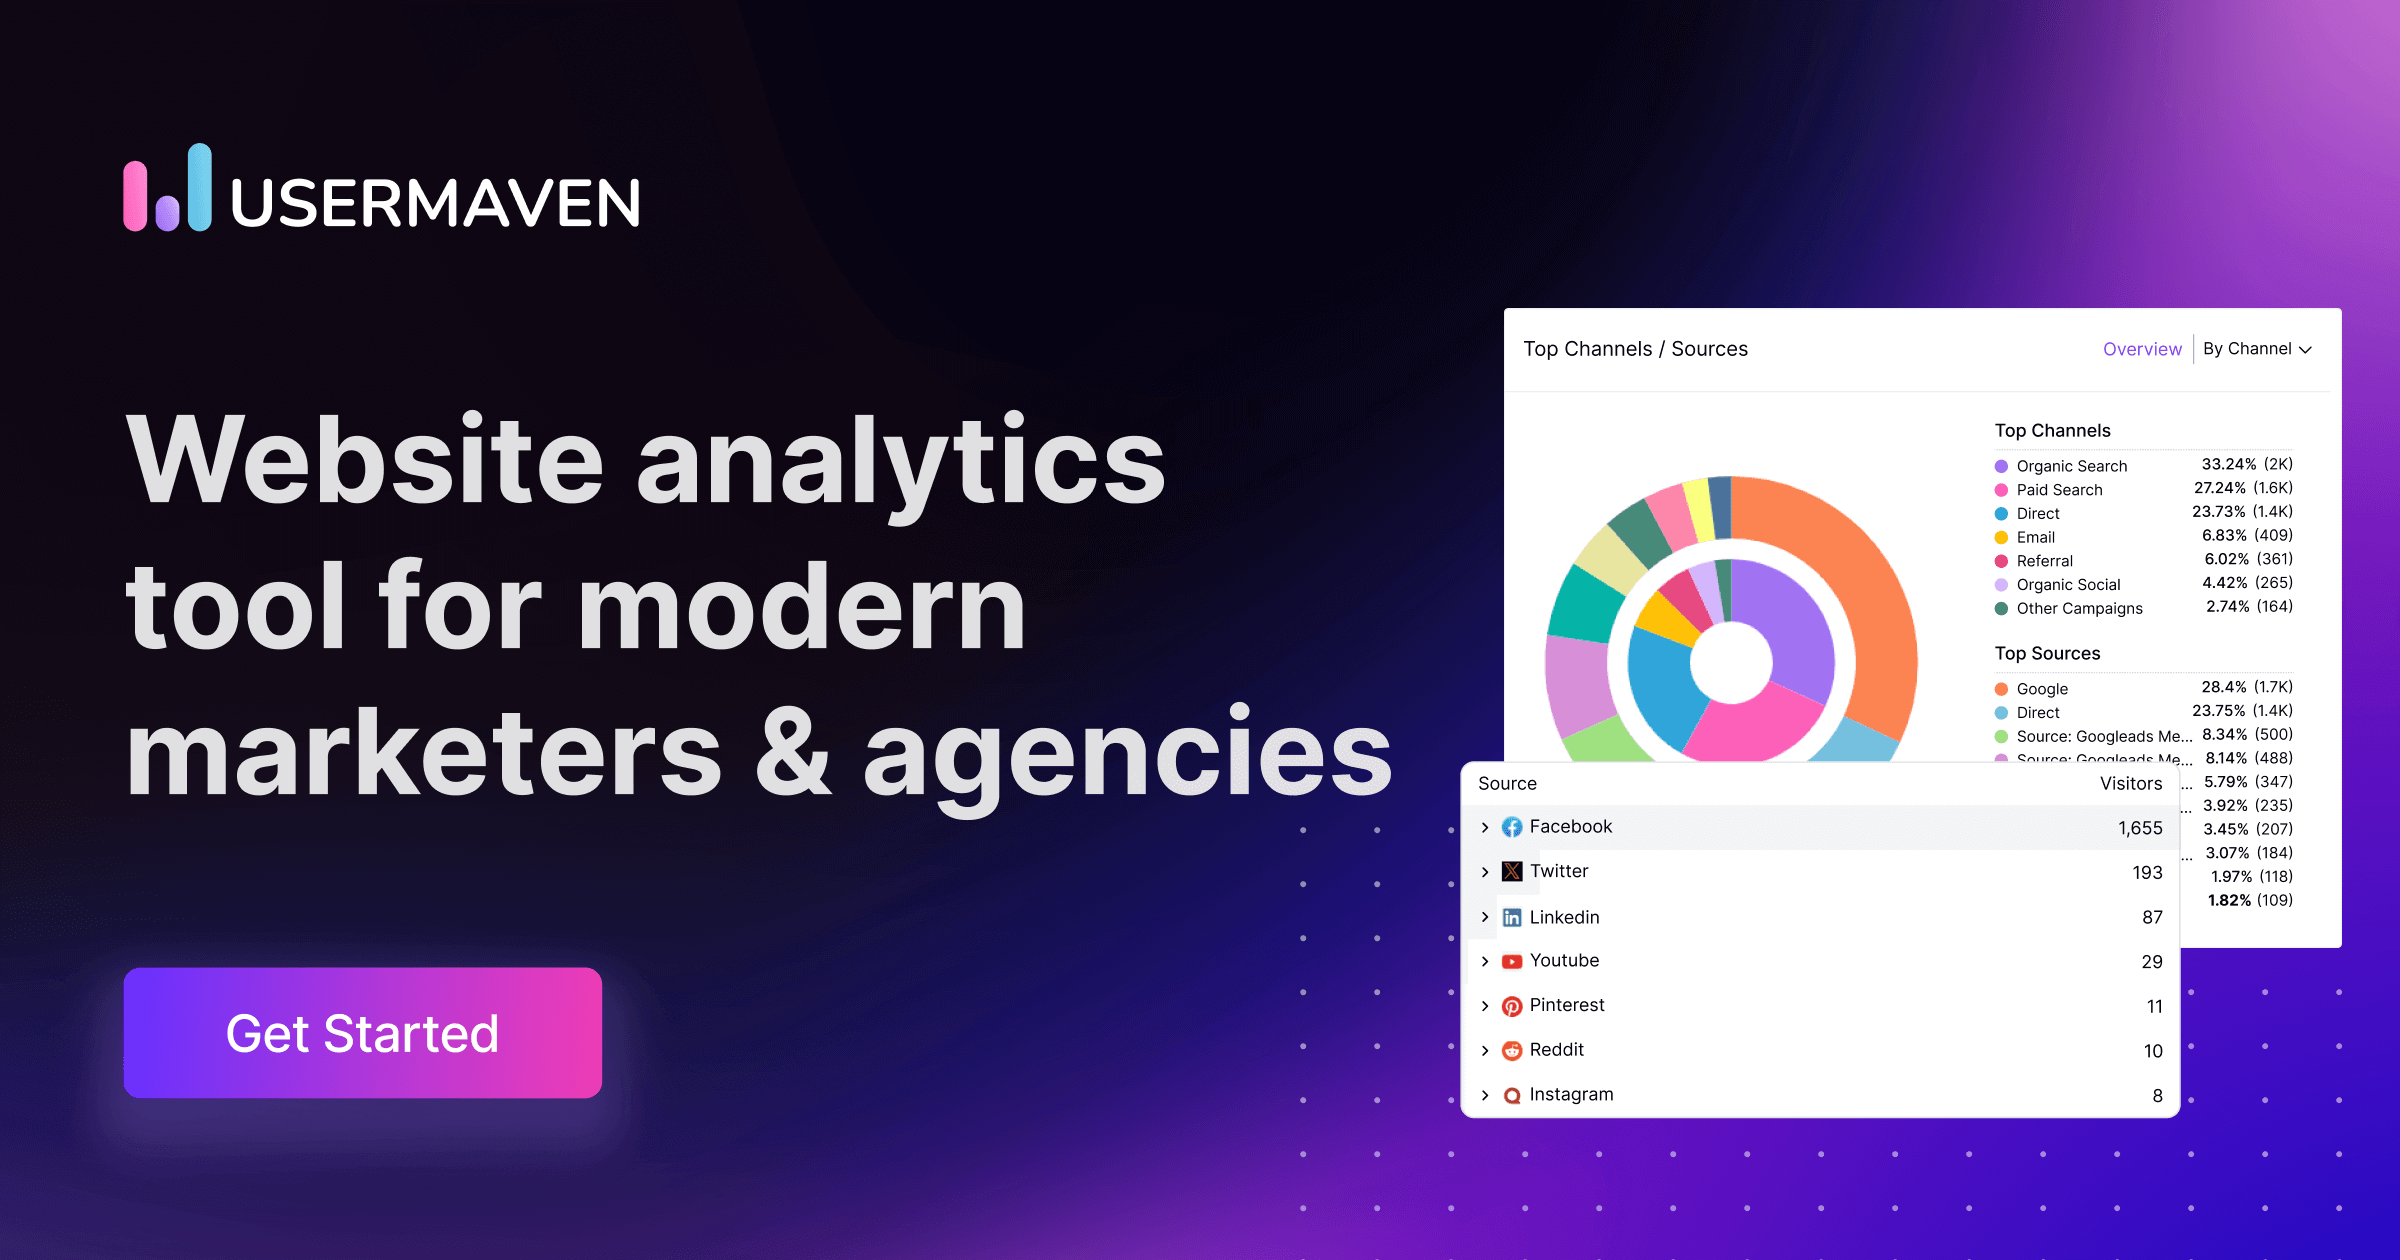
Choosing the right web analytics tool: Why Usermaven is the best?
When it comes to selecting a web analytics tool, Usermaven stands out as a powerful and user-friendly option, especially for businesses looking for comprehensive insights without the complexity of some enterprise-level tools.
Here’s why Usermaven should be at the top of your list:
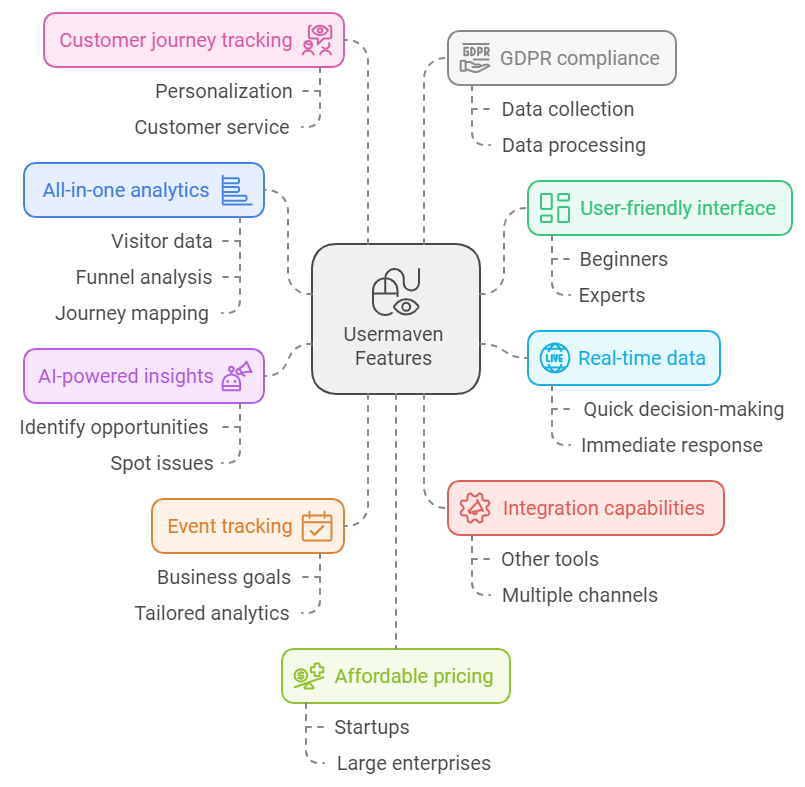
- All-in-one analytics: From basic visitor data to advanced funnel analysis and journey mapping, Usermaven provides a complete picture of your website’s performance in one unified platform.
- User-friendly interface: Its intuitive dashboard makes it easy for both beginners and experts to access and interpret data, reducing the learning curve and enabling quick decision-making.
- Real-time data: Get instant insights into your website’s performance, allowing for quick decision-making and immediate response to trends or issues.
- AI-powered insights: Usermaven’s advanced AI algorithms provide automated insights and suggestions, helping you identify opportunities and issues you might otherwise miss.
- Event tracking: Easily set up and monitor specific actions that are important to your business goals, allowing for tailored analytics that match your unique needs.
- Integration capabilities: Usermaven can integrate with various other tools and platforms, providing a centralized view of your digital performance across multiple channels.
- Customer journey tracking: Unlike some platforms that only provide aggregate data, Usermaven allows you to drill down into individual user journeys, providing invaluable insights for personalization and customer service.
- GDPR compliance: With data privacy becoming increasingly important, Usermaven ensures your analytics are collected and processed in compliance with regulations, giving you peace of mind.
- Affordable pricing: Offering competitive pricing plans, Usermaven makes advanced analytics accessible to businesses of all sizes, from startups to large enterprises.
- Excellent support: Usermaven’s dedicated support team and comprehensive documentation ensure you can make the most of the platform’s capabilities.
By choosing Usermaven, you’re not just getting numbers – you’re gaining a partner in interpreting those numbers and turning them into actionable strategies for growth. Whether you’re looking to optimize your marketing campaigns, improve user experience, or boost conversion rates, Usermaven provides the tools and insights you need to make data-driven decisions and stay ahead in the competitive digital landscape.
End-note
In the world of online business, knowledge truly is power – and web analytics is your key to that knowledge. So, dive in, start analyzing, and watch as your data-driven decisions transform your online presence and propel your business forward.
Here you have it all! Hope it helped. Happy analyzing.
Start your 30-day free trial with Usermaven
Frequently asked questions (FAQs)
1. What is the difference between web analytics and website analytics?
Web analytics and website analytics are often used interchangeably. Both refer to the process of collecting, analyzing, and reporting website data. However, web analytics can sometimes encompass a broader scope, including data from mobile apps and other digital platforms, while website analytics typically focuses specifically on website data.
2. How do I start implementing web analytics for my website?
To start implementing web analytics:
- Choose a web analytics tool like Usermaven
- Install the tracking code on your website
- Set up goals and events you want to track
- Start collecting data
- Regularly review and analyze your data
- Make data-driven decisions to improve your website
3. How long does it take to gather meaningful data from web analytics?
The time it takes to gather meaningful data can vary depending on your website’s traffic volume. Generally, for sites with moderate traffic, you can start seeing useful patterns within a few weeks. However, for more accurate insights, especially for seasonal trends, you may need several months of data.
4. How can web analytics help improve my website’s SEO?
Web analytics can help improve SEO by:
- Showing which keywords are driving traffic to your site through the keyword rank checker.
- Identifying which pages have high bounce rates (potentially indicating poor content or user experience)
- Revealing which content is most engaging to visitors
- Tracking the performance of your backlinks
- Monitoring your site’s loading speed
5. How often should I check my web analytics data?
The frequency of checking your analytics depends on your business needs. Daily checks can help you spot immediate issues or opportunities. Weekly or monthly reviews are good for tracking progress toward goals. Quarterly reviews can help identify longer-term trends. The key is to check often enough to stay informed but not so often that you react to every minor fluctuation.
6. Can web analytics track individual users?
Some web analytics tools, including Usermaven, offer features for tracking individual user journeys. However, this is often done anonymously or with user consent to comply with privacy regulations. This capability can provide valuable insights into user behavior and preferences.
7. What’s the difference between a pageview and a unique visitor in web analytics?
A pageview is counted each time a page on your website is loaded by a browser. A unique visitor, on the other hand, represents a single user who may view multiple pages. For example, if one person views five pages on your site, that would count as five pageviews but only one unique visitor.
8. How can I use web analytics to increase my conversion rate?
Web analytics can help increase conversion rates by:
- Identifying which traffic sources bring in the most conversions
- Showing which pages have the highest and lowest conversion rates
- Revealing where users are dropping off in your conversion funnel
- Tracking the impact of changes you make to your website or marketing strategies
Remember, the key to improving conversion rates is not just collecting data, but acting on the insights you gain from that data.
Leave a Reply