
Are you drowning in a sea of website data but struggling to extract meaningful insights? Web analytics reports are your lifeline to understanding website performance and driving business growth.
These reports provide crucial metrics and data-driven insights that help businesses make informed decisions, optimize marketing strategies, and enhance user experiences.
By mastering the art of creating effective web analytics reports, you can unlock the full potential of your online presence.
Understanding why web analytics reports matter and learning to put them together correctly is key for any marketer, brand, or agency to analyze how its website performance stands out.
In this blog post, we’ll explore expert tips and actionable insights on creating and analyzing web analytics reports that are not only comprehensive but also easy to understand, empowering you to excel online.
We’ll also explore how AI-powered analytics tools like Usermaven can streamline the web analytics reporting process and provide valuable insights quickly, correctly, and efficiently.
What are web analytics reports, and why do they matter?
Web analytics reports are essentially snapshots of a website’s performance. They compile data on how users interact with a website, providing insights into website traffic, user behavior, and the effectiveness of online marketing campaigns. This information is gathered through web analytics tools and presented in various formats such as tables, graphs, and charts.
These reports cover a wide range of metrics, including:
| Category | Metrics |
|---|---|
| Website Traffic | Number of visitors, page views, and bounce rates |
| User Behavior | Time spent on site, pages per session, and conversion rates |
| Marketing Performance | Traffic sources, keyword performance, conversion goals, and campaign ROI |
| User Demographics | Age, gender, location, and device information |
By analyzing these reports, businesses can gain a deep understanding of their online audience and how their website is performing.
By diving into this data, companies can figure out which parts of their website are hitting it off with users and which parts might need a bit more work. They also show which marketing efforts are bringing in the most traffic and leading to actual sales or sign-ups.
Related: Website visitor’s sources
Key components of an effective web analytics report
You need a solid web analytics report to get a handle on how well your website is doing and what people are up to when they visit. This kind of report breaks down into some main parts that give businesses the full picture.
- Starting with key metrics like how many people drop by your site (website traffic).
- How engaged they are while there (user engagement).
- Quickly leaving after landing on just one page (bounce rate).
- How long do they stick around during each visit (average session duration)?
- If they’re taking actions you want them to take, like buying something or signing up (conversion rates).
These numbers are super important because they let businesses see where things might be going wrong and check if their marketing moves are working out.
By looking at trends over time or spotting patterns in the data, companies can figure out why users behave in certain ways on their sites. This insight is gold for making choices based on facts rather than guesses so that websites can become more user-friendly and effective at keeping visitors interested.
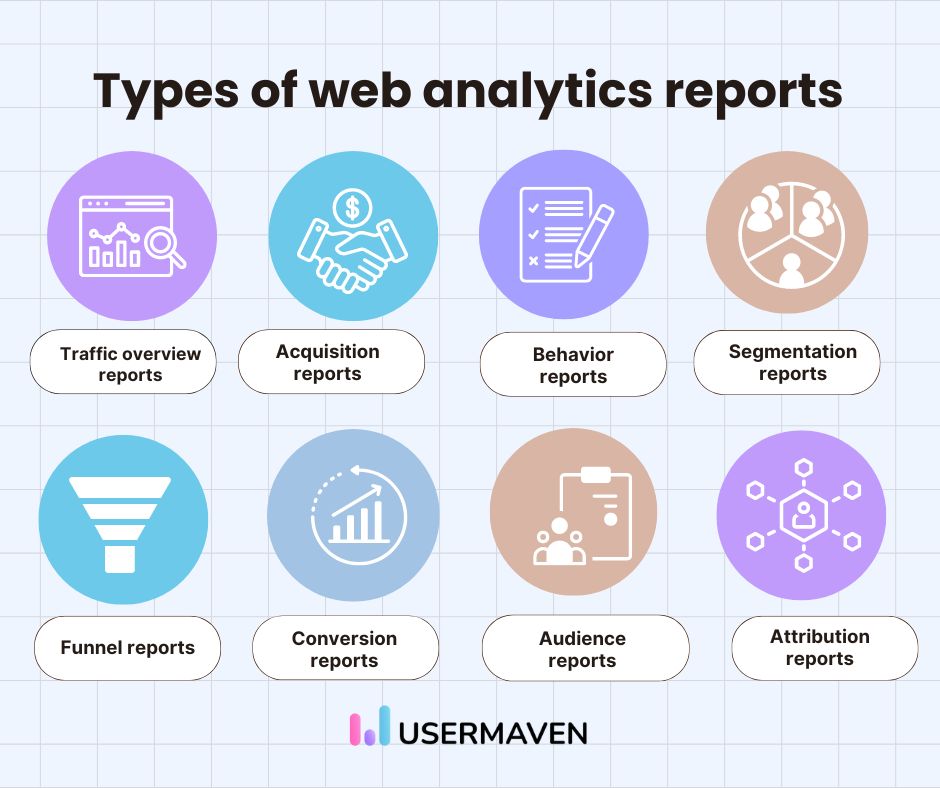
Types of web analytics reports
There are numerous web analytics reports, each offering unique insights into website performance. These reports can be categorized based on different aspects of website activity, such as audience behavior, marketing effectiveness, and website performance.
We are going to discuss a few of the types:
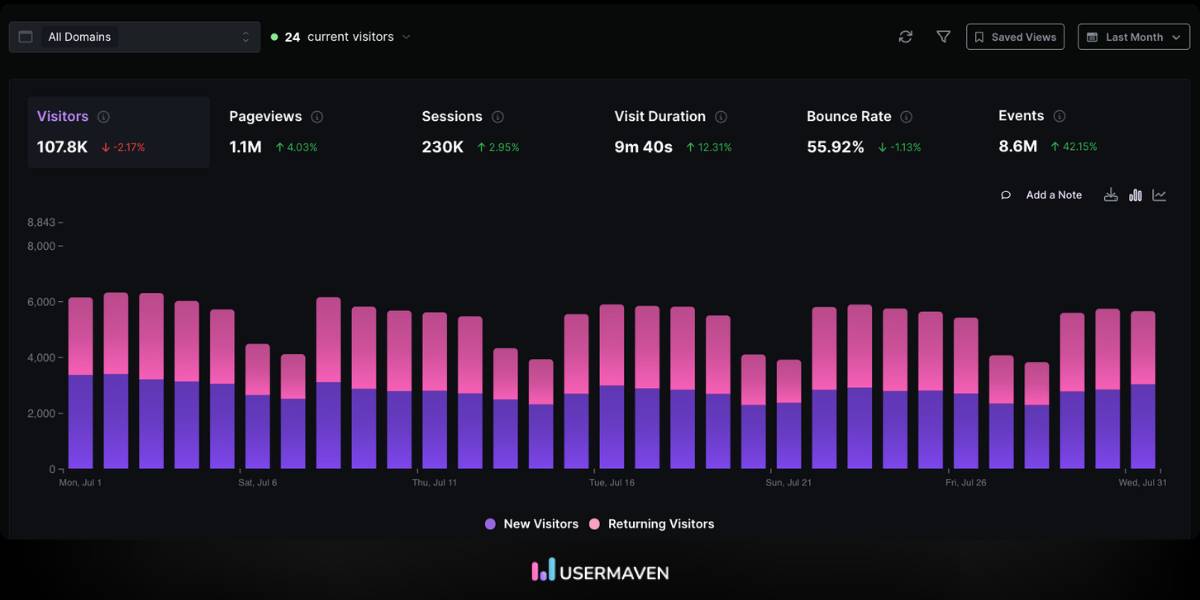
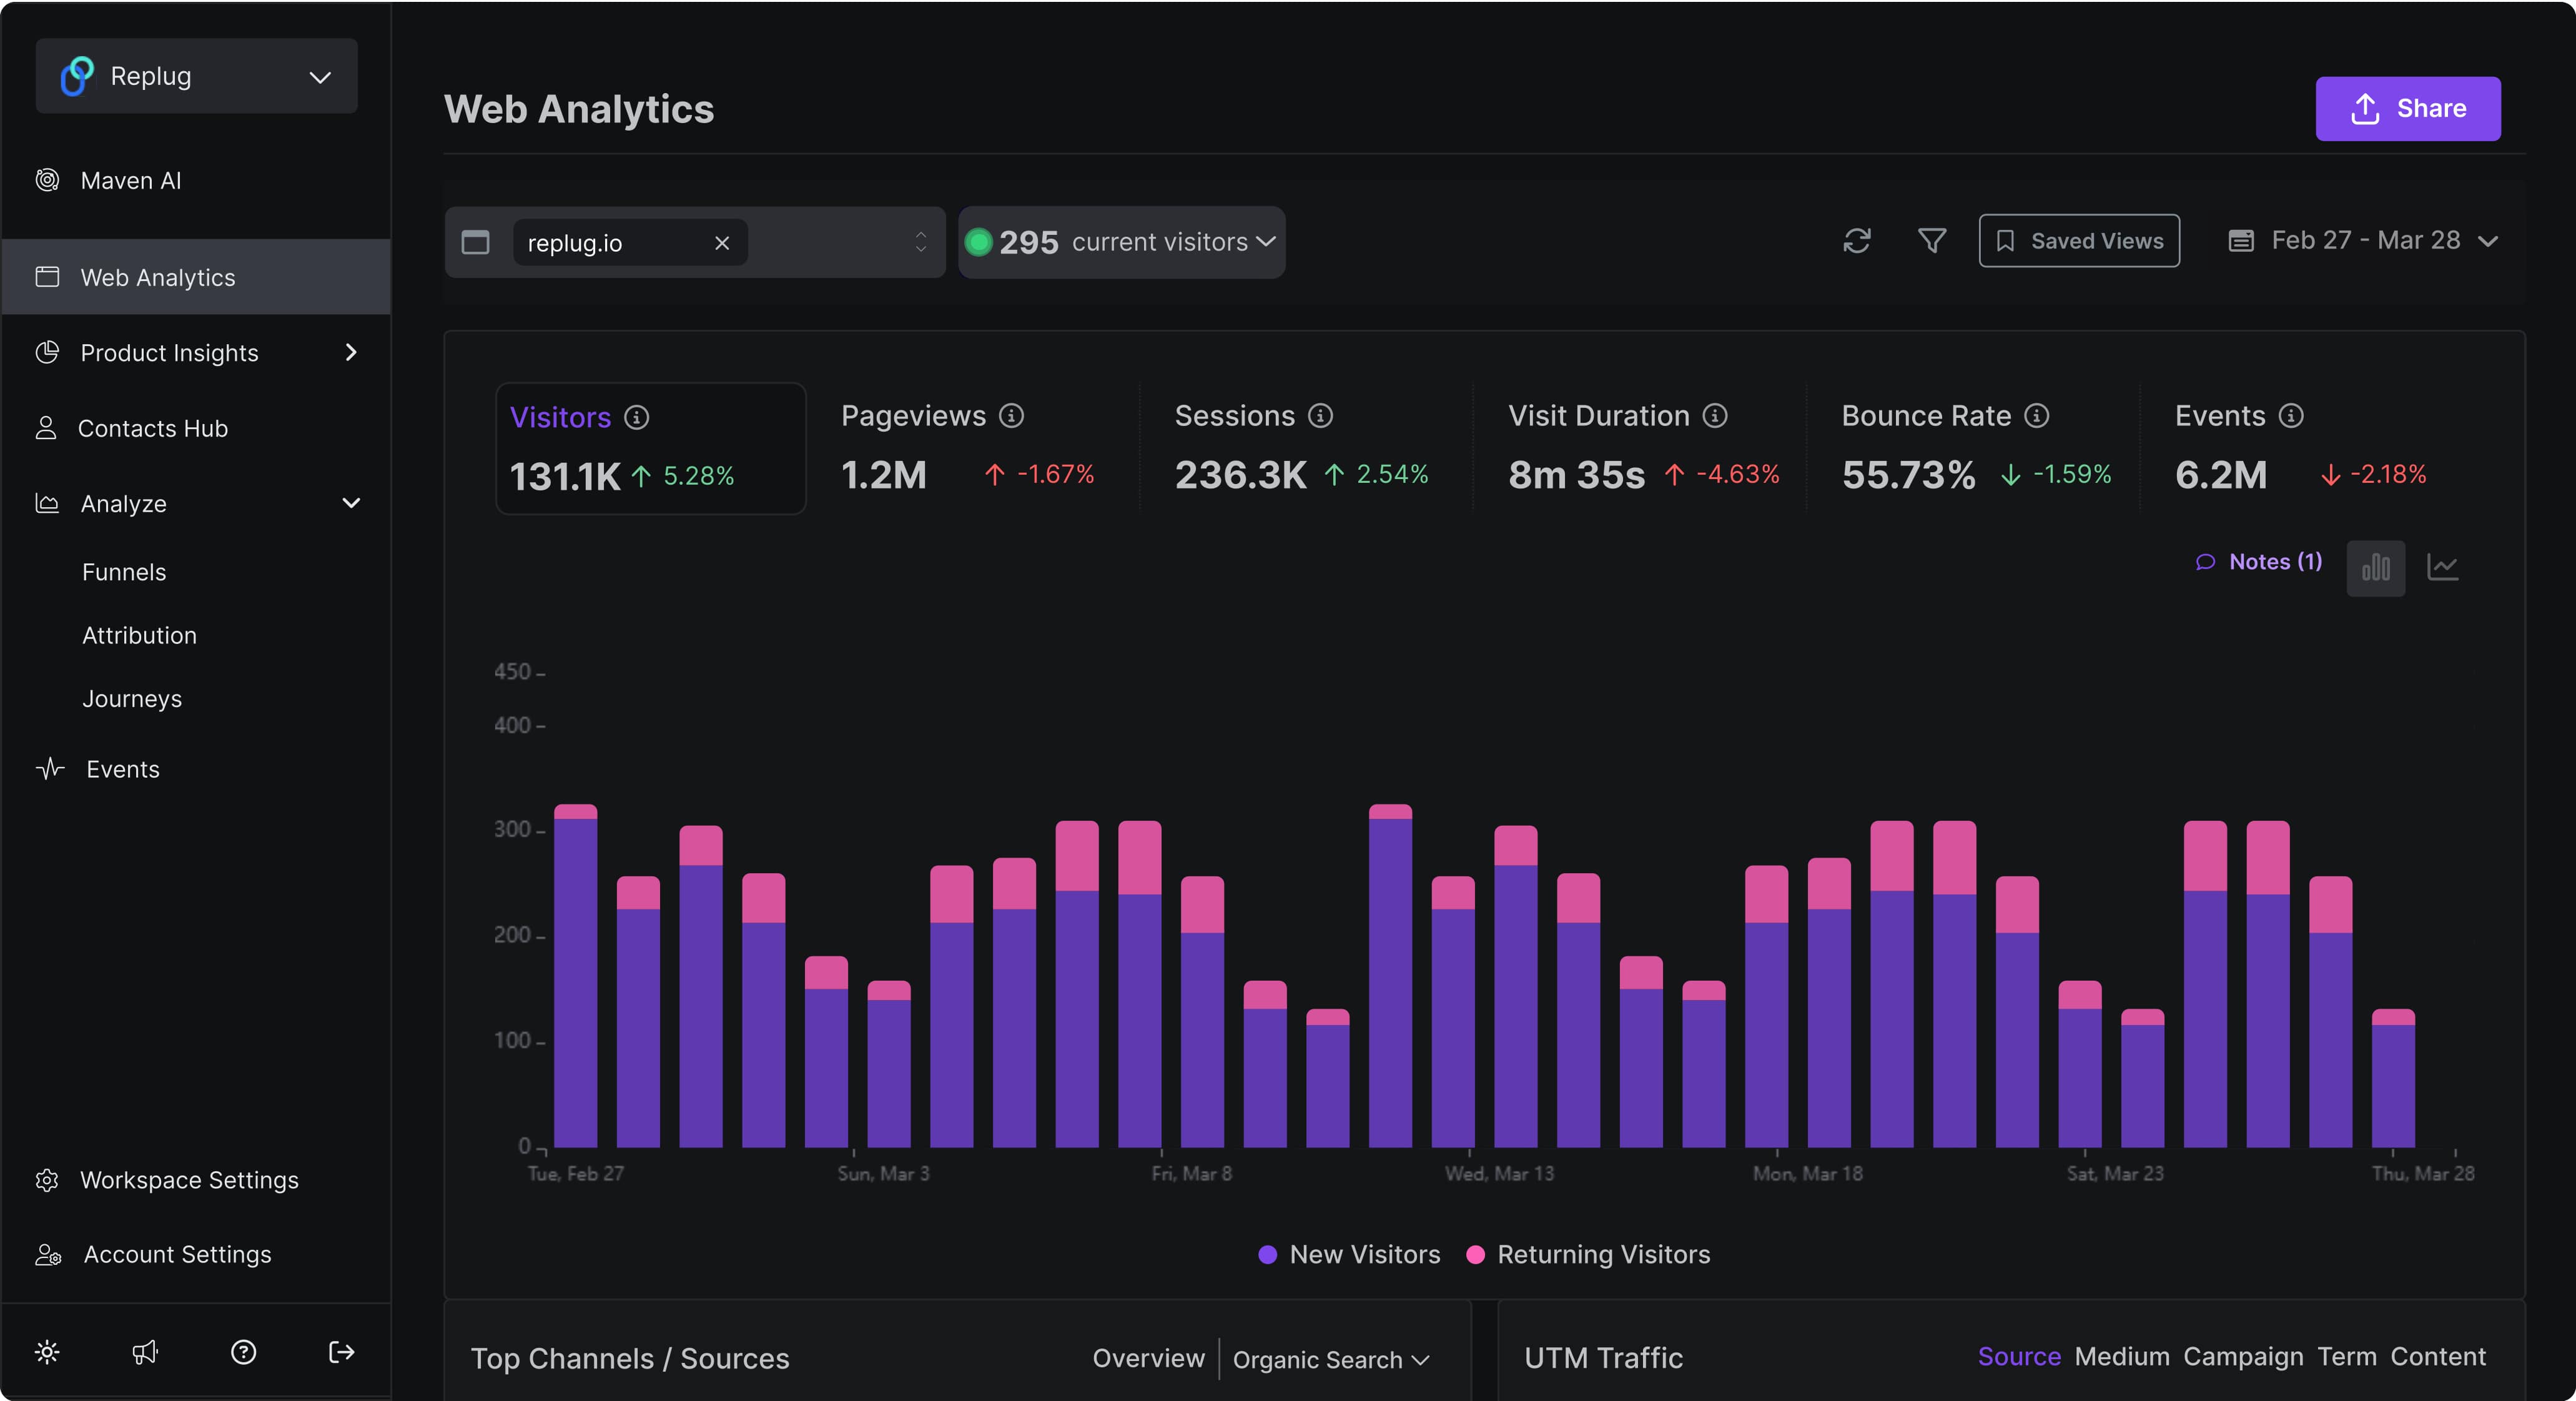
Traffic overview reports
These reports provide a high-level view of your website’s overall performance.
- Unique visitors: The number of individual users visiting your site
- Pageviews: Total number of pages viewed, including repeated views
- Bounce rate: Percentage of single-page sessions where users left without interacting
- Average session duration: How long users typically spend on your site
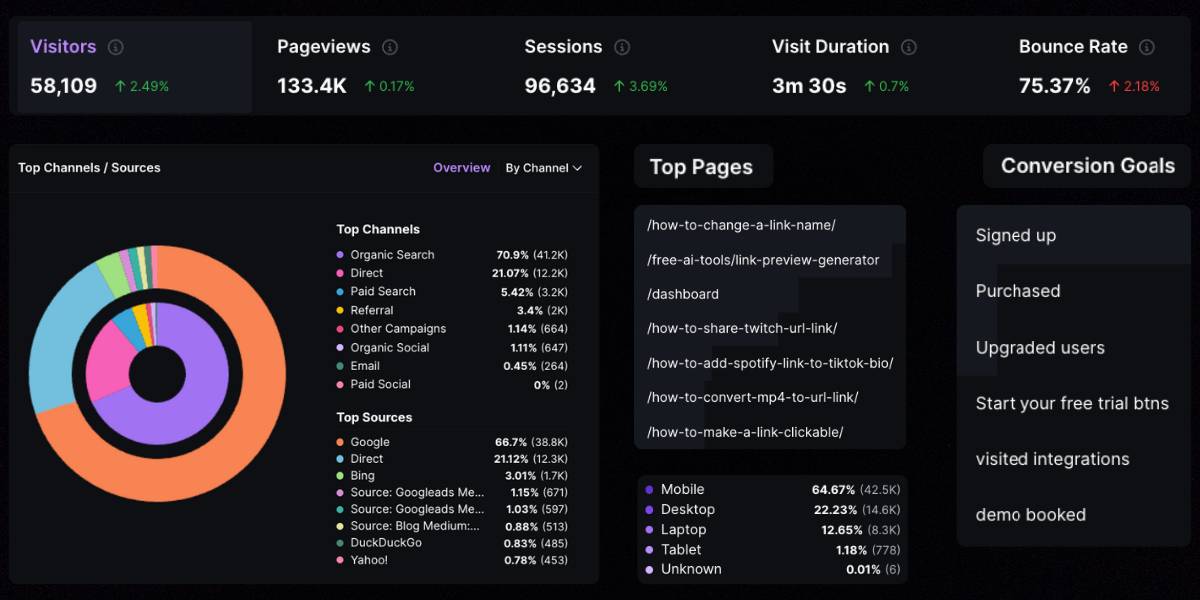
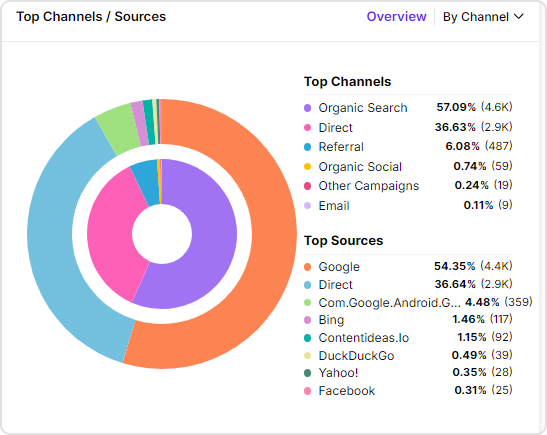
Acquisition reports
Acquisition reports show how users are finding your website.
- Traffic sources: Break down of organic, paid, direct, referral, and social traffic
- Channel performance: How different marketing channels contribute to your goals
- Campaign effectiveness: Success metrics for specific marketing campaigns
Behavior reports
These reports detail how users interact with your site once they’re there.
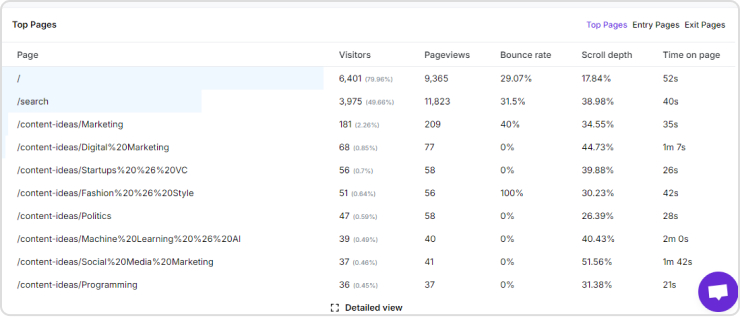
- Most visited pages: Your top-performing content
- User journey: The paths users typically take through your site
- Site search analysis: What users are searching for on your site
- Content analysis: Detailed performance metrics for site sections and pages
Conversion reports
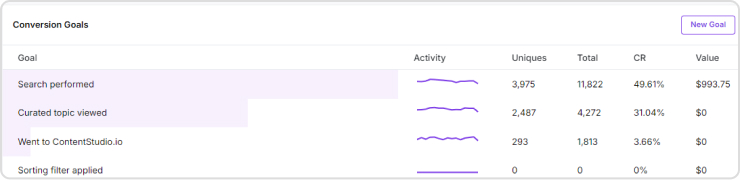
Conversion reports focus on how well your site is achieving its goals.
- Goal completions: Tracking of specific actions you want users to take
- E-commerce transactions: Sales data for online stores
- Conversion funnels: Visual representation of the user journey to conversion
- Attribution modeling: Understanding which channels contribute to conversions
Audience reports
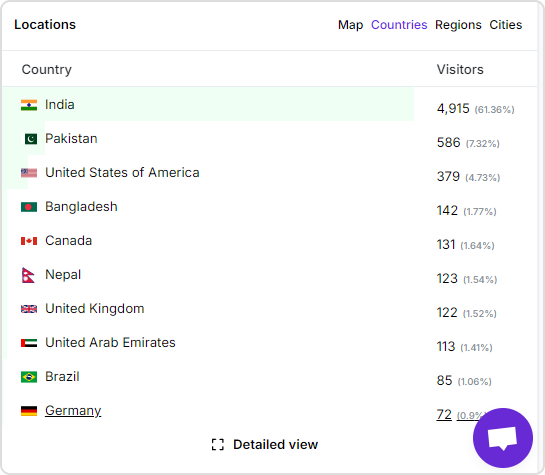
These reports provide insights into who your users are.
- Demographics: Age and gender breakdown of your audience
- Interests: Categories that your audience is interested in
- Geolocation: Where your users are located
- Technology used: Devices, browsers, and operating systems of your users
Related: 19 most important website metrics to track for growth
Funnels reports
Funnel reports provide a visual representation of the user journey through a predefined set of steps toward a goal.
- Step-by-step analysis: Track user progression through each stage of your funnel.
- Conversion rates: Measure the percentage of users who complete each step.
- Drop-off points: Identify where users are leaving the funnel. Funnel optimization: Use insights to improve conversion rates at each stage.
Related: Funnel analysis 101
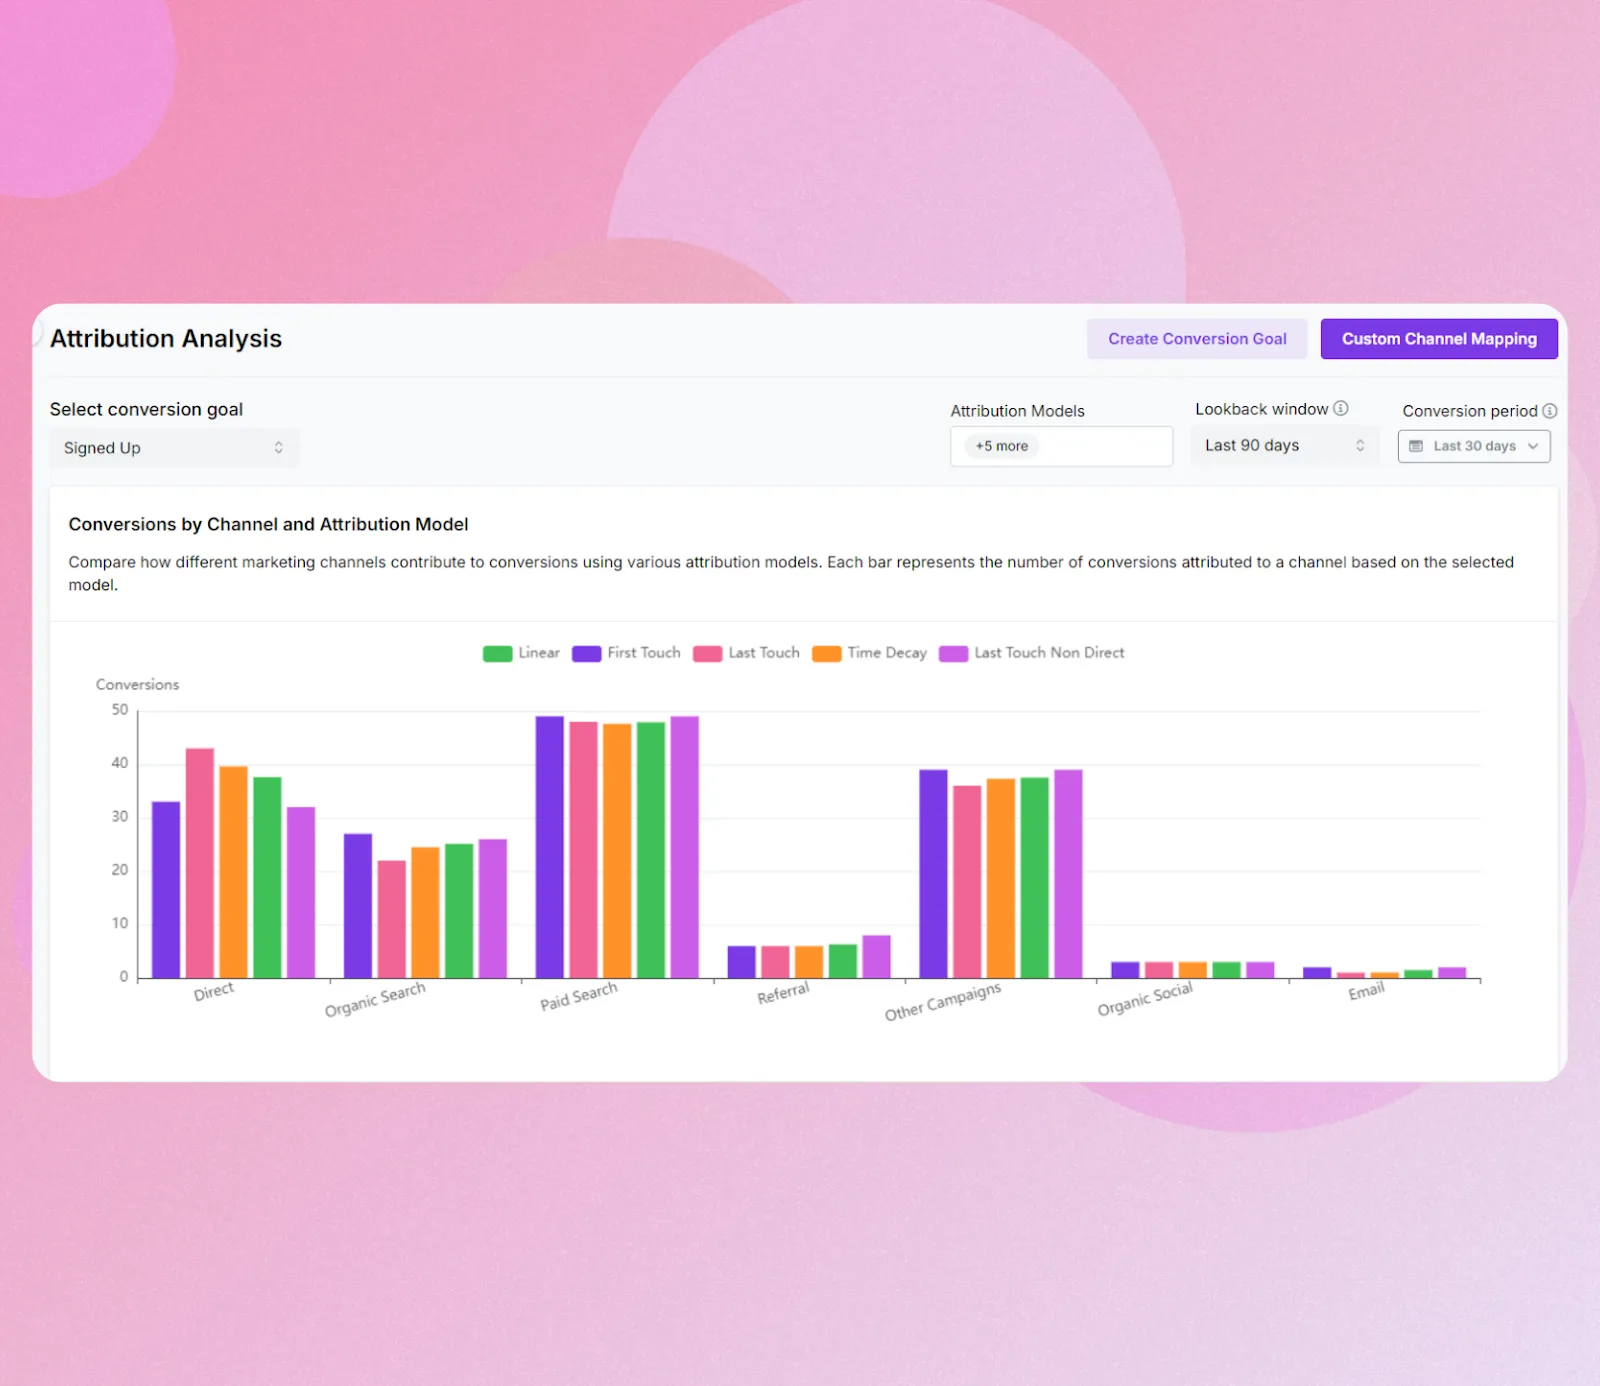
Attribution reports
Attribution reports help you understand which marketing channels and touchpoints contribute to conversions.
- Multi-channel attribution: Analyze the impact of various marketing channels on conversions.
- Attribution models: Compare different attribution models (e.g., first-click, last-click, linear).
- Assisted conversions: Identify channels that play a supporting role in the conversion process.
- ROI analysis: Determine the effectiveness and value of each marketing channel.
Related: Multi-touch attribution
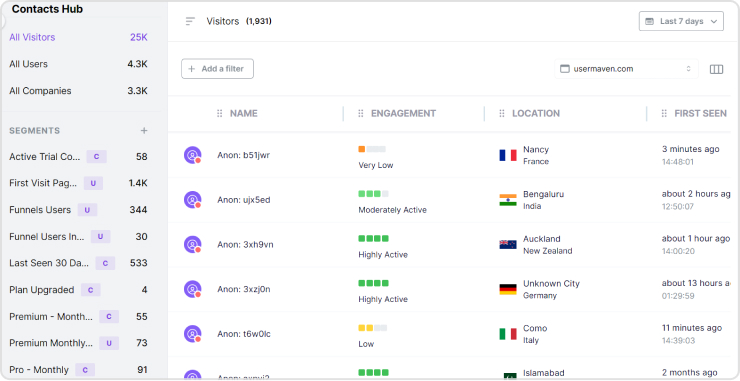
Segment reports
Segment reports allow you to analyze specific subsets of your audience based on various criteria.
- Custom segments: Create and analyze user groups based on behavior, demographics, or other factors.
- Comparative analysis: Compare performance metrics across different segments.
- Personalization insights: Gain actionable insights for tailoring content and experiences to specific user groups.
- Audience targeting: Identify high-value segments for focused marketing efforts.
Related: Segmentation analysis
Crafting an effective web analytics report
To put together your first web analytics report, you need to start by gathering all the important information and making sure it’s easy for everyone to understand. This can be done using a web analytics dashboard or putting together a detailed SEO report.
Collecting and analyzing data
Gathering and looking into the numbers is key while creating web analytics reports. This means keeping an eye on different kinds of information related to how people use websites, what they do there, and the results of online marketing efforts.
For gathering this information, companies can turn to web analytics tools like Usermaven. These help by showing who’s coming to your site, how engaged they are, how often they convert from visitors to customers and other important information.
After all that data is in hand, it’s time to dive deep into it. Doing so with things like which pages folks spend time on or what actions they take while visiting your website helps businesses understand more about their audience.
Digging into these details brings really useful knowledge about whether marketing moves are working out well. It shows which ones pull in lots of visits or lead people to buy something or sign up for more info—letting businesses fine-tune their approach based on solid facts rather than guesses.
Keeping tabs on all this isn’t a one-and-done deal; it’s ongoing work that needs regular attention for any business wanting its website game strong.
Visualizing data for better understanding
Turning complex info into simple visuals is a smart move. Think about it like this: when businesses use pictures, charts, and tables, they can show off their data in a way that’s easy to get. For example, in reports on how websites are doing, showing the data visually is key for understanding all sorts of stats and what users do on the site.
Here’s why making your web report full of visuals is a good idea:
- It makes things clearer: When you see data as pictures or graphs, figuring out stuff like how long people stay on pages or how many times a page was looked at gets easier.
- Spotting trends becomes faster: With visual help, spotting if more folks are visiting your website or if something unusual happens with user actions takes less time.
- Sharing insights gets simpler: Visuals make sharing what you’ve found from your web report much smoother so everyone can quickly catch up on the main points.
In these kinds of reports about website performance:
- Line charts come in handy for tracking changes over time—think about seeing whether people spend more time reading content now than before.
- Bar charts work great when you want to look at different numbers side by side; maybe compare the bounce rate now versus last month across several pages.
- Pie charts shine when breaking down parts of something bigger; they’re perfect for showing types of traffic or various ways users interact with your site.
So bringing visualization techniques into play within your web analytics reporting game plan allows presenting intricate details attractively and understandably.
This approach helps those involved easily digest important information regarding;
- Bounce rates
- Web analytics outcomes
- Website traffic flows
- Conversion rates shift
- Average duration engagements
- Website effectiveness
- Page views
Web analytics reports in Usermaven
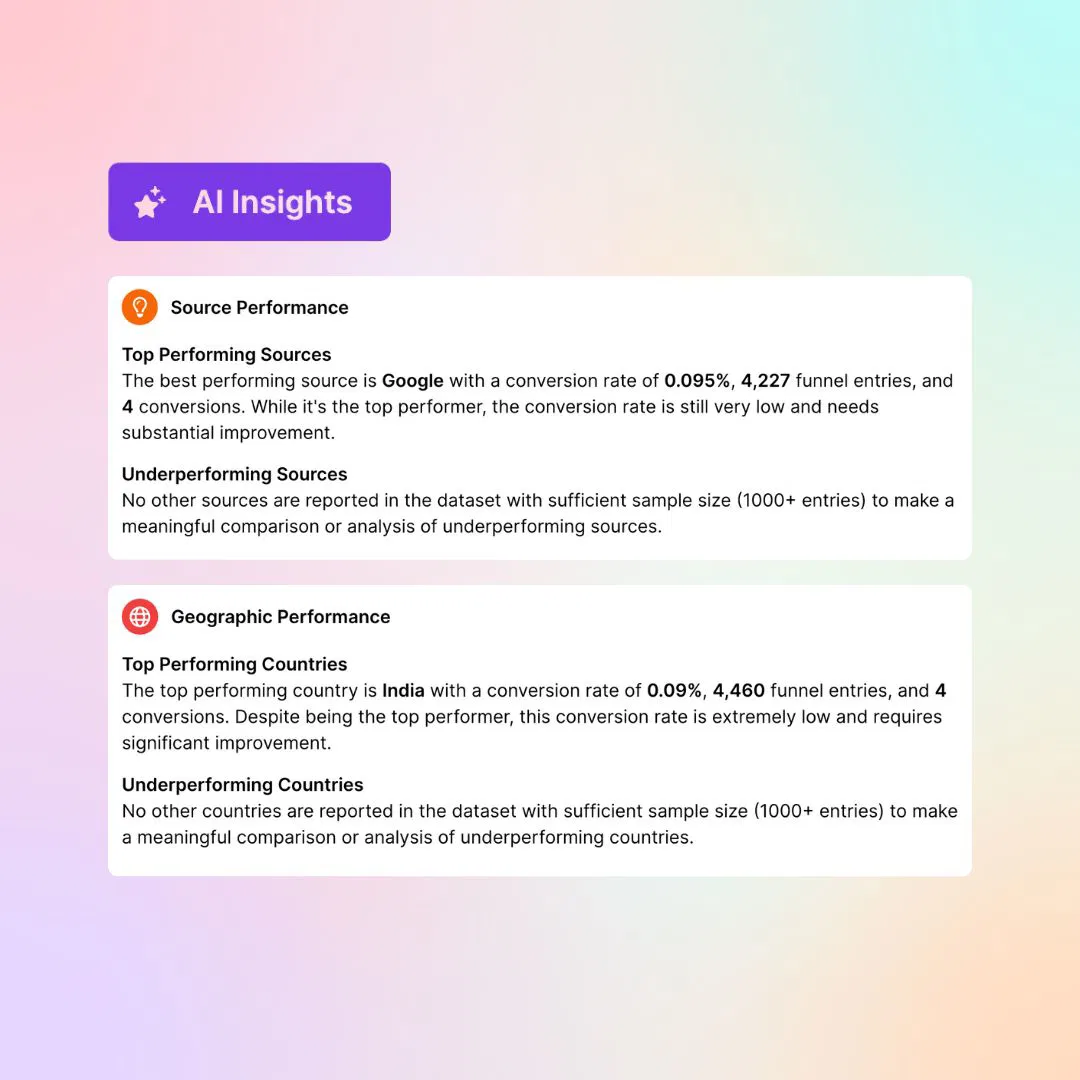
Usermaven effortlessly created precise and accurate web analytics reports, designed to provide businesses with actionable insights into their website performance. By combining flexibility, customization, and comprehensive data, Usermaven empowers businesses to make data-driven decisions and optimize their online strategies.
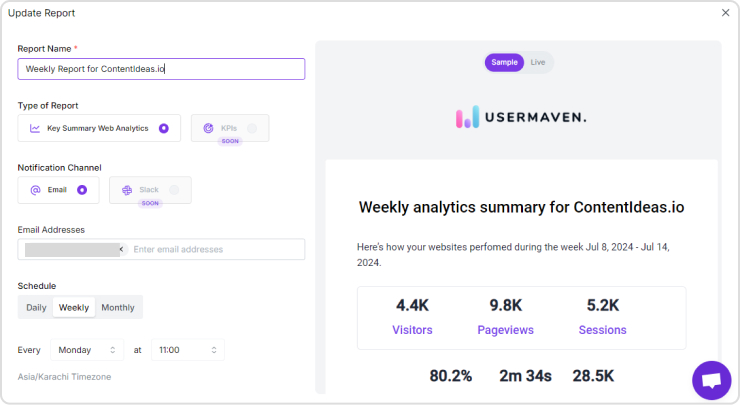
Core features:
- Customizable report creation: Users have the freedom to create and name reports tailored to specific metrics or KPIs, allowing for focused analysis.
- Diverse report types: A range of report formats, including the foundational “Key Summary Web Analytics” and upcoming KPI-centric reports, cater to various analytical needs.
- Versatile notification channels: Choose from email or Slack to receive reports, ensuring timely access to critical data.
- Flexible scheduling: Set up daily, weekly, or monthly report delivery to align with business reporting cycles.
- Live reporting: Access real-time data to monitor website performance and react quickly to changes.
- Comprehensive performance metrics: Track essential website metrics such as visitors, pageviews, sessions, bounce rate, average session duration, and total events to gain a holistic view of website activity.
- In-depth conversion analysis: Monitor conversion goals, track conversion numbers, and calculate conversion rates to measure marketing campaign effectiveness.
- Top page performance insights: Identify high-performing pages to optimize content and user experience.
The platform’s dedicated “Reports” section introduces advanced customization capabilities:

- Flexible scheduling with time zones: Set up recurring reports with precise delivery times and time zone considerations.
- Interactive report preview: Visualize report content before finalization to ensure accuracy and alignment with expectations.
- Professional branding: Maintain brand consistency with integrated company branding elements.
- User-friendly interface: Navigate the platform effortlessly with a clean and intuitive design.
By offering these comprehensive and customizable features, Usermaven enables businesses to extract maximum value from their web analytics data, driving informed decisions, improving website performance, and ultimately achieving business objectives.
Conclusion
To understand user behavior and make good decisions, it’s important to regularly check web analytics. Picking the right tool and knowing which key performance indicators (KPIs) matter most will help you present data clearly. Breaking down data for better insights and combining information from different sources can give a complete picture, leading to better business results.

FAQs
How often should I check my web analytics?
The best frequency for checking web analytics depends on your business goals. Monthly reports often suffice, but weekly or daily checks might be necessary for fast-paced industries.
How can I make my web analytics reports more useful?
Focus on key performance indicators (KPIs) aligned with your business objectives. Analyze metrics like average session duration and bounce rate to understand user behavior and make data-driven decisions.
What are the best web analytics tools?
Usermaven is a popular and effective choice for web analytics. It offers a comprehensive suite of tools to help businesses understand their audience, measure website performance, and optimize online strategies.
Leave a Reply