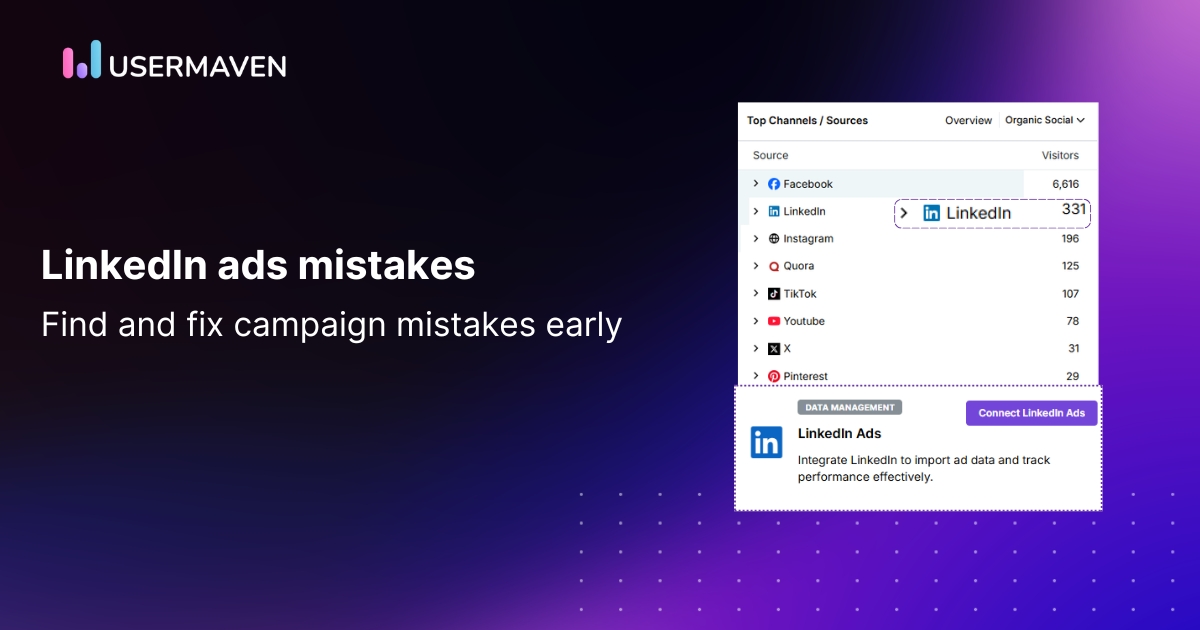
LinkedIn ads are a marketer’s dream: precise targeting, professional audiences, and high intent.
But they’re also one of the easiest places to waste money.
You set up a campaign, pick a few filters, and watch the clicks roll in. Everything looks fine until you realize no one’s converting.
Here’s the thing: most LinkedIn ad mistakes are invisible at first. They don’t break your campaign overnight; instead, they quietly eat away at your budget while your metrics still look “okay.”
That’s why you need analytics.
A LinkedIn ads analytics tool like Usermaven helps you connect the dots from ad click to customer behavior to conversion. With that visibility, you can catch performance issues before they spiral.
Let’s look at five common LinkedIn campaign errors you can spot (and fix) early using data.
1. Targeting the wrong audience
LinkedIn’s targeting options are incredibly detailed, but that’s both a blessing and a trap.
Many marketers either go too broad (e.g., “Marketing professionals in North America”) or too narrow (e.g., “CMOs at SaaS companies with exactly 200 employees”). Both extremes can kill your results.
Too broad = wasted clicks.
Too narrow = not enough data for optimization.
And here’s a sneaky one: LinkedIn’s “recent or permanent location” default. It includes anyone who’s recently visited your target country, not necessarily people who live there.
So you think you’re targeting the U.S… but half your leads come from overseas.
How to fix it with Usermaven (step by step)
To fix this, start by using analytics to analyze LinkedIn influence. Here is how;
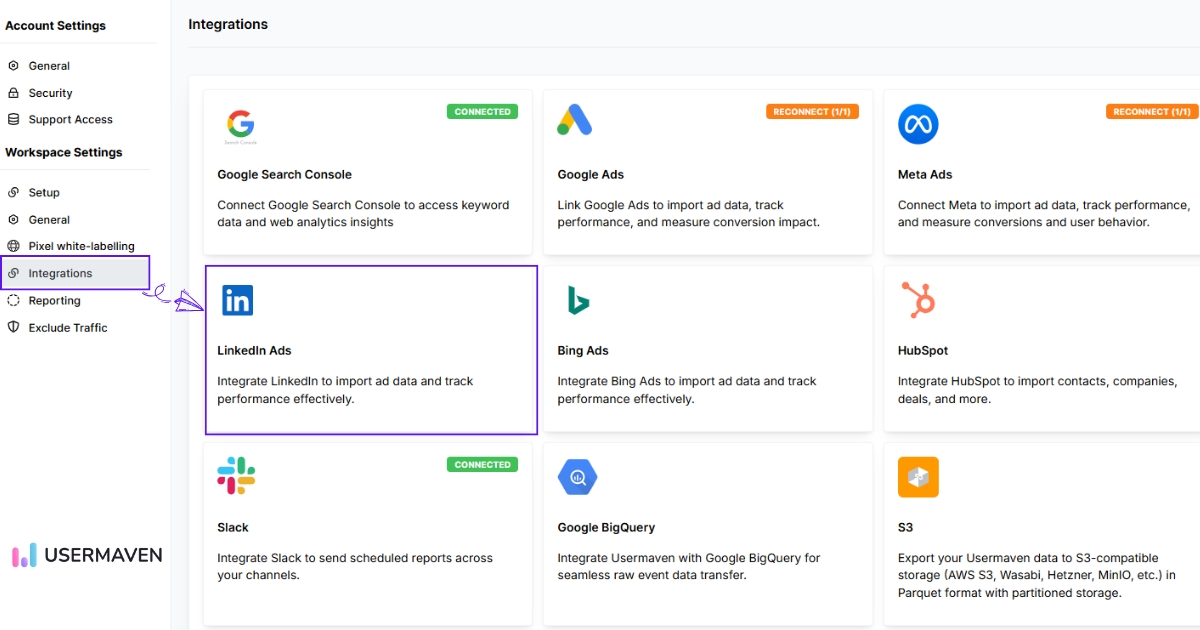
1. Connect LinkedIn Ads to Usermaven
Go to Workspace Settings → Integrations → LinkedIn Ads → Connect.
Log in, approve permissions, and select your active ad account.
Once the status shows Synced, your LinkedIn spend, clicks, and conversions will start appearing in Usermaven.
2. Add tracking parameters
Use this UTM template for accurate attribution:
utm_source=linkedin&utm_medium=paid&utm_campaign={{CAMPAIGN_NAME}}&utm_content={{CREATIVE_ID}}&ad_id={{CREATIVE_ID}}
This connects campaigns and creatives directly to user actions in Usermaven. You can use Usermaven’s free UTM builder tool to create properly formatted links in seconds
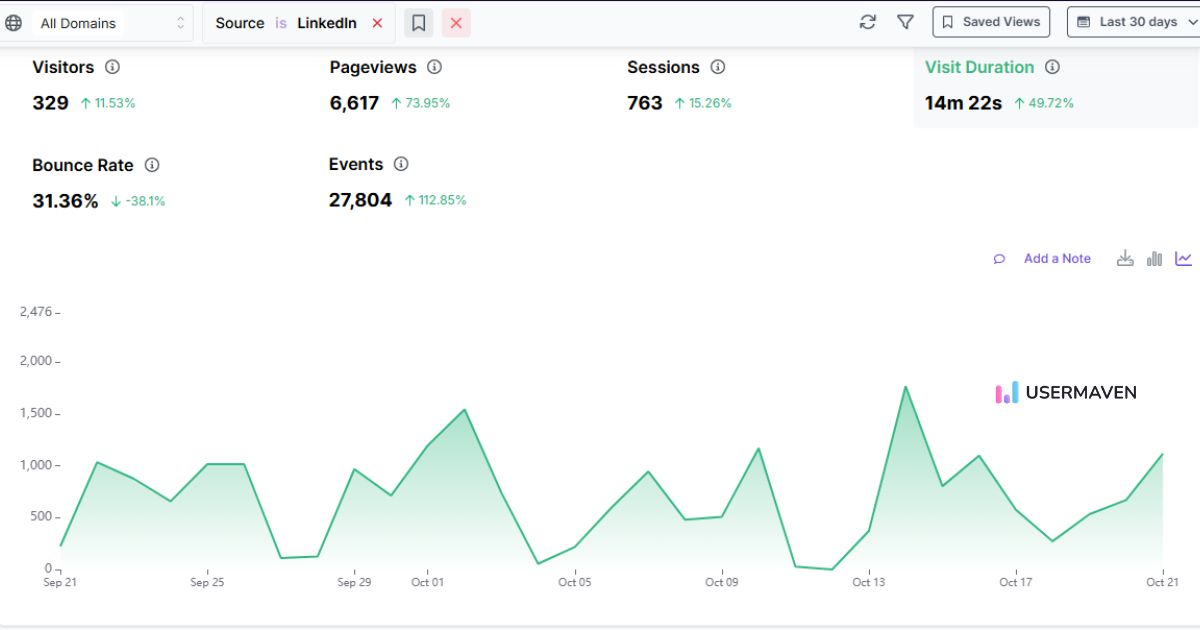
3. Verify your data
Go to Dashboard → Web analytics → Top channels/sources and filter by LinkedIn.
You should see your sessions grouped by campaign name and creative. If not, check that your LinkedIn URLs include the proper UTM and Creative ID.
4. Segment your audiences
In segments, create audience groups using campaign-based UTMs (e.g., “utm_campaign contains marketing-director”).
Add filters like Visited /pricing or Session duration ≥ 30s to focus on quality visitors.
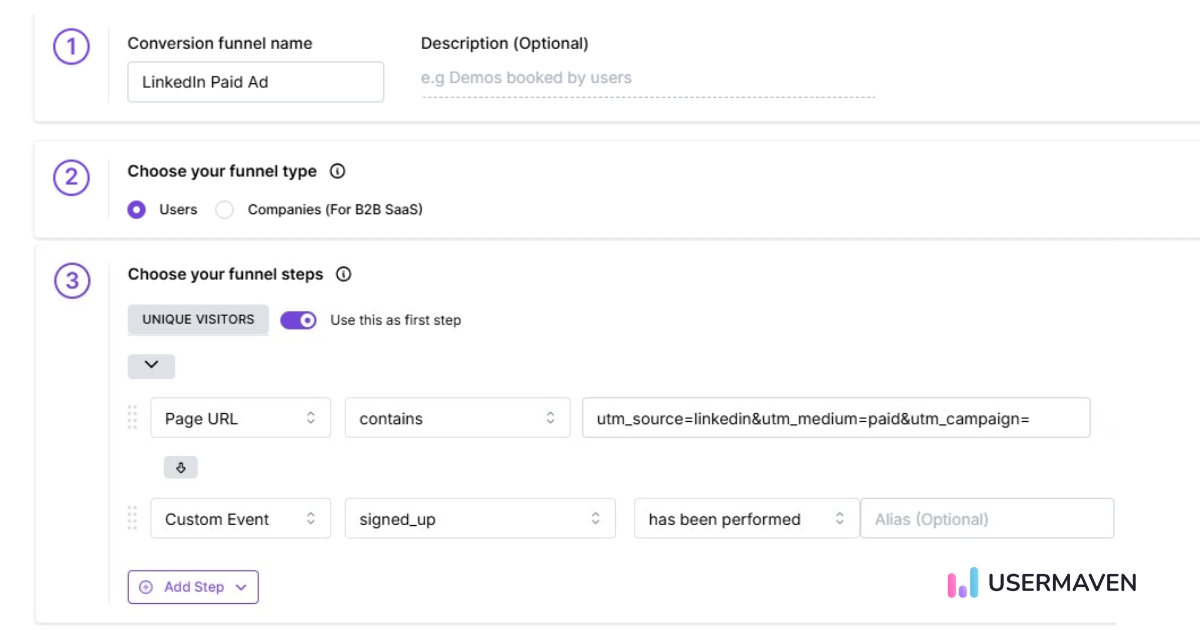
5. Build a funnel
Go to Funnels → Create funnel, then add:
- Source = LinkedIn / paid
- Landing page view
- Form start
- Conversion (e.g., demo booked)
Compare performance across audience segments to find weak points.
6. Check for geo noise
In your funnel, use Breakdown → Country.
If traffic comes from unexpected regions, switch your LinkedIn targeting to a permanent location.
7. Monitor performance
In Dashboards, track:
- Visitors
- Sessions
- Pageviews
- Conversion rate
- Cost per conversion
Set alerts like:
- “LinkedIn conversion rate drops 25% week over week.”
- “Non-target countries exceed 10% of LinkedIn traffic.”
2. Choosing the wrong campaign objective
This is one of those simple but expensive mistakes.
You select “Website visits” because you want traffic, but your real goal is demo signups. So LinkedIn optimizes for clicks, not conversions.
Result: a ton of traffic, zero meaningful leads.
How to fix it
- Choose an objective that matches your end goal, not your vanity metric.
If your target is lead generation, use Website conversions or Lead generation, not “Traffic.” - Once your ads are running, use Usermaven to measure what happens after the click.
Go to Usermaven funnels and track it. This helps you see where users drop off and whether the campaign’s traffic aligns with your goal.
- Set up custom events in Usermaven to track specific conversion actions (like demo form submissions or trial activations).
- Check Web Analytics → Pages and Session duration metrics to spot low-engagement visitors from LinkedIn. These indicate a mismatch between your ad promise and landing page experience.
Pro tip: If you notice high click volume but low on-site engagement in Usermaven, it’s a clear sign your campaign objective is off.
Why attribution matters here
Even if your campaign is tracking the right goal, you still might be missing the real story behind your conversions.
A potential customer could click your LinkedIn ad today, browse your product, come back through a Google search next week, and finally convert after an email reminder. If you rely only on last-click data, LinkedIn gets zero credit, even though it started the journey.
That’s where Usermaven’s attribution models give you complete visibility into how LinkedIn fits into your broader funnel. You can compare five key models depending on your strategy:
- First-touch attribution: Gives full credit to the first interaction, ideal for understanding how LinkedIn drives awareness.
- Last-touch attribution: Credits the final interaction before conversion, which is helpful for tracking direct-response campaigns.
- Linear attribution: Distributes equal credit across every touchpoint in the customer journey, showing how LinkedIn supports other channels.
- Time-decay attribution: Gives more weight to touchpoints closer to conversion, great for longer B2B cycles.
- Position-based attribution (U-shaped): Splits credit between the first and last touch, with some value for everything in between, the perfect model for multi-stage funnels.
This level of insight helps you invest smarter, shifting budget to the campaigns and channels that actually move customers closer to conversion.
Related: LinkedIn attribution
Maximize your ROI
with accurate attribution
*No credit card required
3. Sending traffic to a weak or mismatched landing page
Your ad promises one thing.
Your landing page delivers something else.
That disconnect is one of the most common LinkedIn ads mistakes and one of the fastest ways to lose conversions.
For example:
Your ad headline says, “Book a Free Product Demo.”
The landing page headline? “We’re redefining the future of digital experiences.”
See the problem? Users came for clarity and value, not a brand story.
How to fix it with analytics
- In Usermaven, check your landing page metrics for LinkedIn visitors, session duration, bounce rate, and form starts.
- Compare these against traffic from other sources (like Google Ads or organic). If LinkedIn visitors leave faster, it’s likely a messaging or design mismatch.
- Use session replays or event tracking to see where users stop engaging.
- Use Maven AI inside Usermaven for quick insights. It automatically analyzes your reports and highlights issues.
Then fix the gap:
- Align your ad and landing page messaging.
- Keep your value proposition clear.
- Make sure your CTA matches what you promised in the ad.
The shorter the path from ad promise to action, the higher your conversions will climb.
4. Ignoring retargeting opportunities
Not everyone converts right away. Especially not on LinkedIn, where purchase cycles can stretch for weeks.
But many advertisers treat every campaign as “one and done.” No retargeting, no nurturing, just cold ads all the way.
That’s leaving money on the table.
Imagine a user clicks your ad, spends two minutes on your pricing page, and leaves. Without retargeting, that interest is wasted.
How to fix it with Usermaven
- Use segments to identify warm users, e.g., “Visited pricing page but not /signed-up.”
- In funnels, measure how far these users get before dropping off.
- Export these warm segments to LinkedIn as custom audiences.
- Create retargeting ads with stronger CTAs, such as case studies, demos, or limited offers.
- Track their re-engagement inside Usermaven.
When you can connect the dots from ad → visit → retargeting → conversion, you’ll know exactly what’s working.
5. Setting campaigns on autopilot
Even well-built campaigns need maintenance.
LinkedIn’s audience frequency rises quickly. If you don’t refresh creatives or monitor trends, performance dips silently.
You wouldn’t run your car without checking the oil; your ads are no different.
How to fix it with Usermaven
- Create a LinkedIn performance dashboard with key metrics: sessions, conversion rate, and cost per lead.
- Set weekly check-ins to spot drops or anomalies.
- Watch for “ad fatigue” if CTR drops but impressions remain stable; it’s time for new creatives.
- Use cohort analysis to see if newer campaigns outperform older ones.
- Set automated alerts for performance dips so you act before damage builds up.
Consistent monitoring keeps your campaigns healthy and your spend efficient.
Bonus: How to fix LinkedIn ads performance using data
If you want consistent results, stop treating analytics as an afterthought.
Analytics are your early warning system; they tell you when performance slips, where it’s happening, and why.
Here’s how to use data to keep your campaigns healthy:
- Tag every campaign properly. You can’t analyze what you don’t measure.
- Check your funnel weekly. Where are people dropping off?
- Segment by intent. High-engagement traffic isn’t always high-value.
- Compare audiences. Which targeting brings the best ROI?
- Review conversions, not clicks. Optimize for actions that matter.
Over time, this creates a feedback loop. You’ll stop guessing and start making decisions rooted in real insight.
Final thoughts!
LinkedIn ads can drive incredible ROI when done right, but small errors can sink performance fast.
The key is visibility. Without analytics, you’re guessing which ads, audiences, or offers are working.
Usermaven is a powerful website analytics tool that gives you complete visibility into your LinkedIn ad performance from the first click to the final conversion. You’ll see exactly which campaigns drive revenue, which need fixing, and where your budget delivers the best return.
No guesswork. No wasted spend.
Ready to stop losing money on LinkedIn ads? Book a demo with Usermaven today and start tracking smarter.
Website analytics tool for modern marketers & agencies
*No credit card required
FAQ
1. How soon can you spot LinkedIn ad performance issues with analytics?
Within the first few days of running your campaign. A website analytics tool like Usermaven helps you detect early warning signs like high click volume but no conversions before they become costly.
2. What kind of insights can Usermaven reveal that LinkedIn’s native analytics can’t?
LinkedIn shows ad-level metrics like CTR and impressions. Usermaven, on the other hand, connects those ads to what happens after the click: user journeys, funnel drop-offs, and true conversion paths. That’s where the real optimization happens.
3. Can analytics help you identify fake or low-quality LinkedIn traffic?
Yes. If Usermaven shows high bounce rates or short session durations from a particular campaign or region, that’s a clear sign of irrelevant or low-quality traffic — allowing you to adjust targeting fast.
4. How do tracking errors impact LinkedIn campaign data accuracy?
Missing or inconsistent UTMs can make your LinkedIn traffic appear as “direct” in analytics. With Usermaven, you can spot untagged sessions easily and fix tracking gaps before they distort reporting.
5. What’s the best way to measure LinkedIn’s contribution in a multi-channel funnel?
Use Usermaven’s attribution reports to see how LinkedIn interacts with other channels, whether it’s the first touchpoint or assists conversions later in the journey. This prevents undervaluing its role in your overall strategy.