What if you could grow revenue by 20% this quarter without attracting a single new customer?
Sounds unrealistic, right?
But for many ecommerce brands, that’s exactly what happens when they start optimizing their average order value (AOV).
According to Shopify, a small 10–15% increase in AOV can often outperform the results of a full-scale customer acquisition campaign. The reason? You’re earning more from the customers you already have.
Let’s break down what average order value really means, how to calculate it, and how you can use attribution and analytics to drive higher-value orders.
What is average order value (AOV)?
In simple terms, average order value tells you how much a customer spends on average every time they make a purchase on your store.
It’s one of the most important ecommerce KPIs, used to measure how effectively your store encourages customers to spend more per transaction.
The average order value formula
Average order value = Total revenue ÷ Number of orders
Example: If your ecommerce store generated $50,000 in revenue in one month and processed 1,000 orders, the AOV = $50,000 ÷ 1,000 = $50.
That means, on average, every customer spends $50 each time they buy something from your store.
Why average order value matters for ecommerce brands
Most ecommerce marketers spend a fortune on ads to drive new traffic. But what if you could make every purchase more valuable instead?
Here’s why increasing AOV should be a top priority for ecommerce brands:
- Boosts profit without raising CAC. A higher AOV directly improves your return on ad spend (ROAS) because acquisition costs stay constant while order value grows.
- Strengthens your pricing and bundling strategy. It helps identify what mix of products or price thresholds motivates customers to spend more.
- Improves cash flow and margins. Bigger baskets mean higher revenue per transaction, often with only slightly higher fulfillment cost.
- Drives smarter decision-making. When connected with the attribution dashboard and funnel analytics, AOV shows which channels and campaigns bring in high-value buyers.
Think of it as the difference between running on a treadmill (chasing new buyers) versus climbing an escalator (earning more from existing ones).
How to calculate and interpret AOV correctly
While the average order value formula is simple, how you interpret it makes the difference.
AOV best practices
- Always use the same time period for revenue and orders (e.g., monthly, quarterly).
- Exclude refunds or canceled orders to avoid skewing results.
- Decide whether to include or exclude shipping and taxes, and stay consistent.
- Segment your AOV by customer type, channel, and campaign for actionable insights.
Example segmentation
| Segment | Orders | Revenue | AOV |
| New customers | 1,200 | $36,000 | $30 |
| Returning customers | 800 | $44,000 | $55 |
| Email campaign | 300 | $20,000 | $66 |
| Paid social ads | 900 | $27,000 | $30 |
Here, email-driven sales bring a much higher AOV. That insight alone helps you decide where to invest marketing budget next, if you’re tracking campaign attribution properly.
Benchmarks and metrics to track alongside AOV
A “good” average order value (AOV) looks different for every industry:
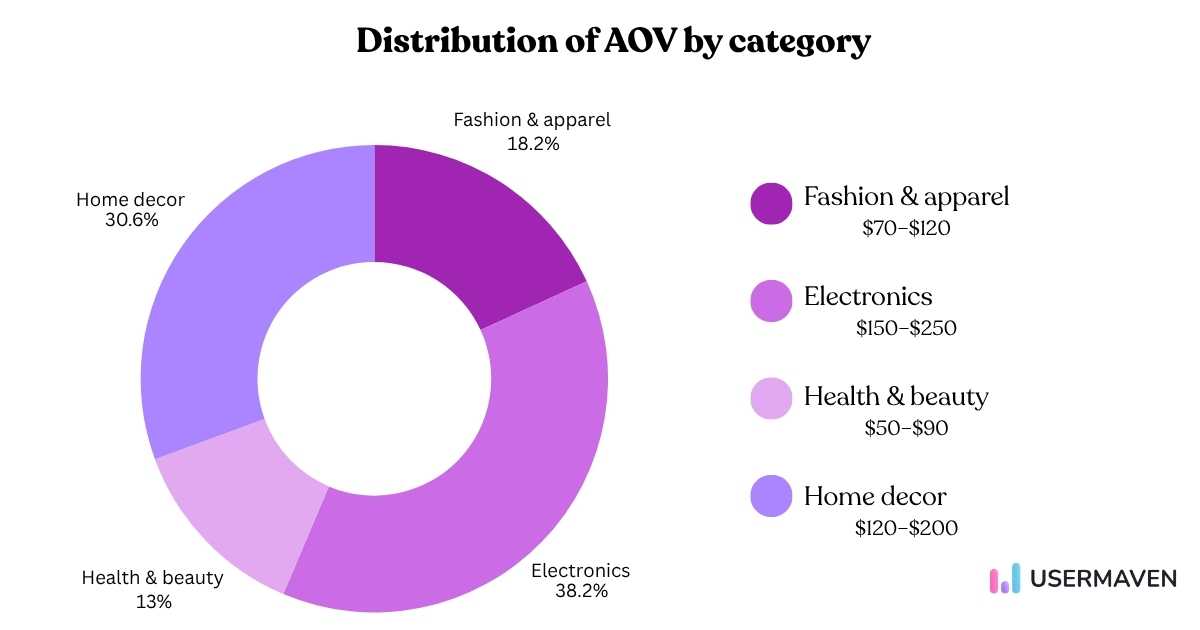
These numbers offer a baseline, but your goal shouldn’t be to “beat the average.” Instead, aim to grow your own AOV sustainably based on customer behavior, pricing, and profit margins.
A $60 AOV could be stellar for a skincare brand but underwhelming for an electronics store. Context is everything.
To get the full picture, track AOV alongside other important KPIs:
- Conversion rate: Are more shoppers completing checkout?
- Customer acquisition cost (CAC): Are you spending efficiently to get new customers?
- Return on ad spend (ROAS): Do your campaigns bring in higher-value orders?
- Customer lifetime value (CLV): Is your higher AOV leading to longer-term or annual revenue growth?
- Order margin/profit: A higher AOV means little if your margins shrink.
- Repeat purchase rate: Big first orders are great, but repeat buyers sustain growth.
- Channel or cohort AOV: Which channels, campaigns, or customer groups bring the most valuable orders?
Together, these metrics give you a balanced view of how AOV fits into your overall ecommerce conversion funnel, helping you make smarter, data-backed growth decisions.
7 Strategies to increase average order value
Here are effective tactics that ecommerce brands can use, especially when supported by web analytics and attribution insights.
1. Upselling and cross-selling
Encourage customers to buy a more expensive version of what they were already considering (upsell) or complementary items (cross-sell).
Examples:
- If a customer is selecting a standard laptop, offer them the premium version with extra features.
- If a customer adds a camera to the cart, recommend a memory card, tripod, or bag.
Tip: Use Usermaven, the best analytics tool for ecommerce brands, to see which upsell/cross-sell offers drive the largest AOV lift and attribute them to specific channels.
2. Bundle offers or kits
Group related products into a bundle at a slight discount compared to buying them individually.
For example: “Buy the shirt + matching tie + pocket square for 10% off” makes it easier for the customer to spend more.
Make sure your attribution system can track if bundles convert better and which sources drive bundle purchases.
3. Free shipping threshold
Set a minimum order value for free shipping slightly above your current average order value. This nudges customers to add more to hit the threshold.
Let’s say, if your current AOV is $45, set free shipping at $60.
Track how many customers add items to their cart to qualify for this threshold, and attribute which campaigns drive those incremental spends.
4. Price tiers or volume discounts
Offer discounts when customers buy more items or spend more money overall.
For example: “Spend $100 and get 15% off” or “Buy 3, get 20% off”.
Your web analytics dashboard should show which discount tiers produce the best margin impact and which channels drive that behaviour.
5. Improve product recommendations
With Usermaven’s segments and behavioral analytics, your product recommendations stop being generic and start driving higher-value orders.
Use attribution to see which recommendation algorithms or channel sources produce higher-value orders.
For example, if data shows that customers coming via email respond best to “premium bundle” recommendations, you can double down there.
6. Optimize checkout flow and remove friction
With Usermaven’s funnels, you can spot where high-value shoppers drop off during checkout and fix those issues quickly.
When customers can add items easily, see their basket value, and move smoothly through checkout, they’re more likely to spend more.
- Usermaven highlights cart abandonment patterns and key bottlenecks across different steps. This helps you see exactly where potential high-AOV orders are lost.
- Using attribution insights, you can also identify which channels or campaigns cause more drop-offs and adjust them to boost conversions and order value.
7. Segment by channel, cohort, and campaign
Instead of using a one-size-fits-all approach, use Usermaven’s segments and attribution features to uncover what truly drives higher AOV.
Use Usermaven to analyze:
- Which channel (paid search, social, email) leads to higher AOV?
- Do new customers and returning customers have different AOVs?
- Which campaigns (holiday, bundle, upsell) yield the highest incremental AOV?
With this data, you can see not just “which campaigns drove sales,” but “which campaigns drove higher-value orders.”
That clarity helps you allocate your marketing budget toward the most profitable segments and channels.
How Usermaven grows your AOV
Usermaven helps ecommerce brands grow their AOV by showing which marketing efforts lead to higher-value orders.
With tools like multi-touch attribution, trends, funnels, and journeys, you can see what works best and make smarter decisions to drive bigger baskets.
Multi-touch attribution for complete visibility
With Usermaven’s multi-touch attribution, you can see every step a customer takes before making a purchase, including ads, emails, social posts, or referrals.
This helps you connect each order’s value to the right touchpoints, revealing which channels consistently drive high-AOV sales.
Once you know where the best orders come from, you can confidently invest more in those channels.
Track AOV by channel
Usermaven analyzes AOV across your cross-channel marketing campaigns, showing exactly where your highest-value customers come from.
You might discover, for example, that your email campaigns drive $75 orders while social ads bring $35.
These insights help you focus on the campaigns and platforms that deliver stronger returns and more valuable customers.
Identify assisted conversions
Some campaigns don’t close the sale immediately but still influence a customer’s path to purchase.
Usermaven’s attribution reporting tracks these assisted conversions (one of the most important conversion metrics for digital marketers), showing which campaigns help nurture customers toward larger future orders.
That means you can recognize the true impact of your marketing, not just the last click.
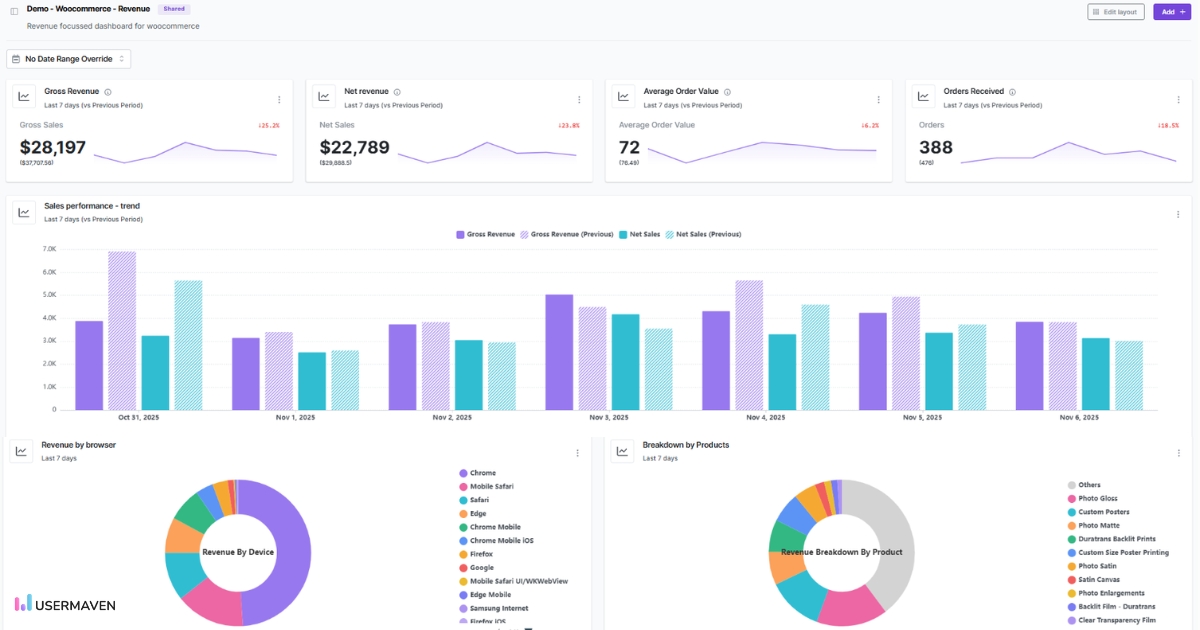
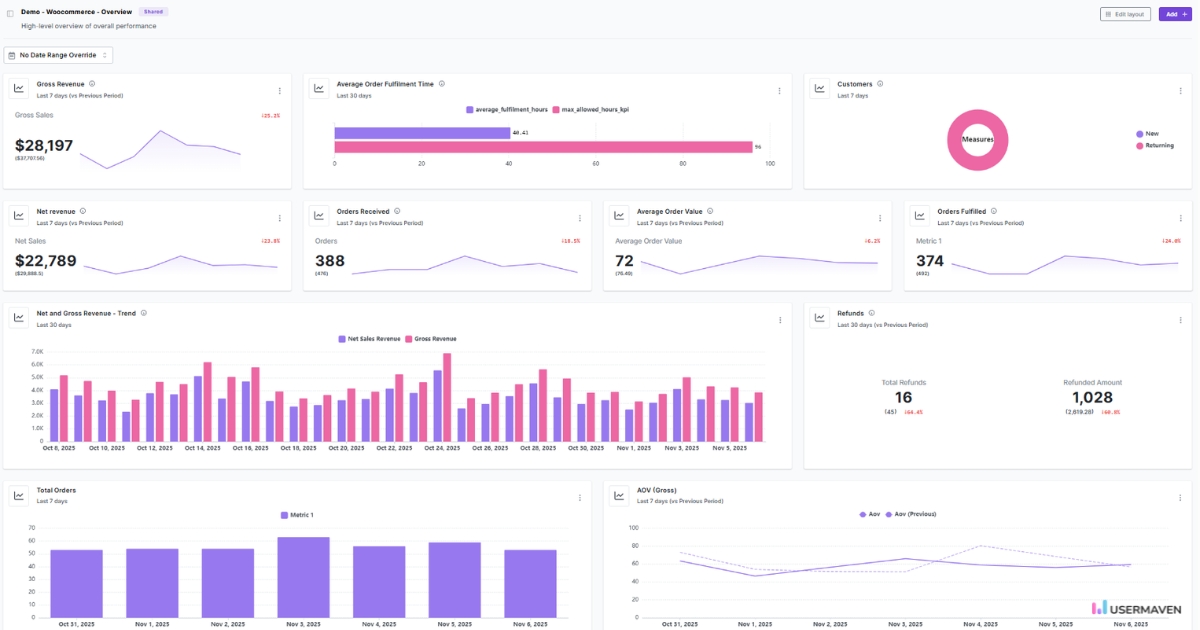
Here is the Usermaven’s woocommerce dashboard overview:
Use funnel analytics to spot high-value drop-offs
Usermaven connects your attribution and funnel analytics data to reveal where high-value shoppers drop off.
Maybe premium buyers abandon at the shipping step, or bundle shoppers hesitate during checkout.
These insights help you fix friction points, recover missed opportunities, and continuously lift your average order value.
See Usermaven in action
Book a free demo and discover how powerful analytics can grow your business.
*No credit card required
Common mistakes that can hurt your AOV
While AOV optimization can transform your growth, beware of these traps:
🚫 Chasing AOV at the expense of conversion rate. If fewer people buy, total revenue might drop.
🚫 Overusing discounts. They raise AOV temporarily but harm margins long-term.
🚫 Ignoring CLV (Customer Lifetime Value). A one-time high AOV means little without repeat purchases.
🚫 Failing to measure attribution. You can’t improve what you can’t trace.
🚫 Overcomplicating the customer experience. Keep upsells relevant and seamless.
Smart AOV growth balances customer delight, margin, and attribution clarity.
Wrapping it up,
If you’re running an ecommerce brand, improving your average order value should be high on your growth agenda. But doing it in a smart way means using analytics and attribution, not hoping for customers to buy more by chance.
With our powerful website analytics tool, you get the clarity to see which channels, campaigns, and customer cohorts drive higher-value orders. You can build and test upsell offers, set thresholds, segment customers, track attribution and funnel behaviour, and then optimise for better orders, not just more orders.
Ready to take control of your AOV and grow smarter?
Try Usermaven’s attribution and funnels modules today and start turning every transaction into more value for your ecommerce brand.
FAQs
1. Does average order value (AOV) include shipping, taxes, or discounts?
It depends on how you define it for your store. Some brands calculate AOV including shipping and taxes, while others exclude them to focus only on product revenue. The key is consistency: decide your definition and apply it the same way each time.
2. How often should I monitor my AOV to catch meaningful trends?
While you can calculate AOV daily, a good practice is to review it monthly and quarterly. Monthly checks help you spot sudden changes (e.g., after a promotion or campaign), and quarterly reviews help analyse bigger patterns and strategy shifts.
3. Can increasing AOV ever be a bad thing?
Yes, if you push for higher AOV without considering conversion rate, margin, or customer experience, you might hurt overall revenue or profitability. For example, aggressive upsells might discourage purchases or reduce margins. (This is why segmentation and attribution are important.)
4. How does AOV relate to device or traffic source?
The device (desktop vs mobile) and traffic source (organic search, email, paid ads) often impact average order size. For example, desktop users may spend more per order, and email‐acquired customers might buy higher value bundles than certain paid traffic. So segmenting by device/source gives better insight.