Category: Latest
-
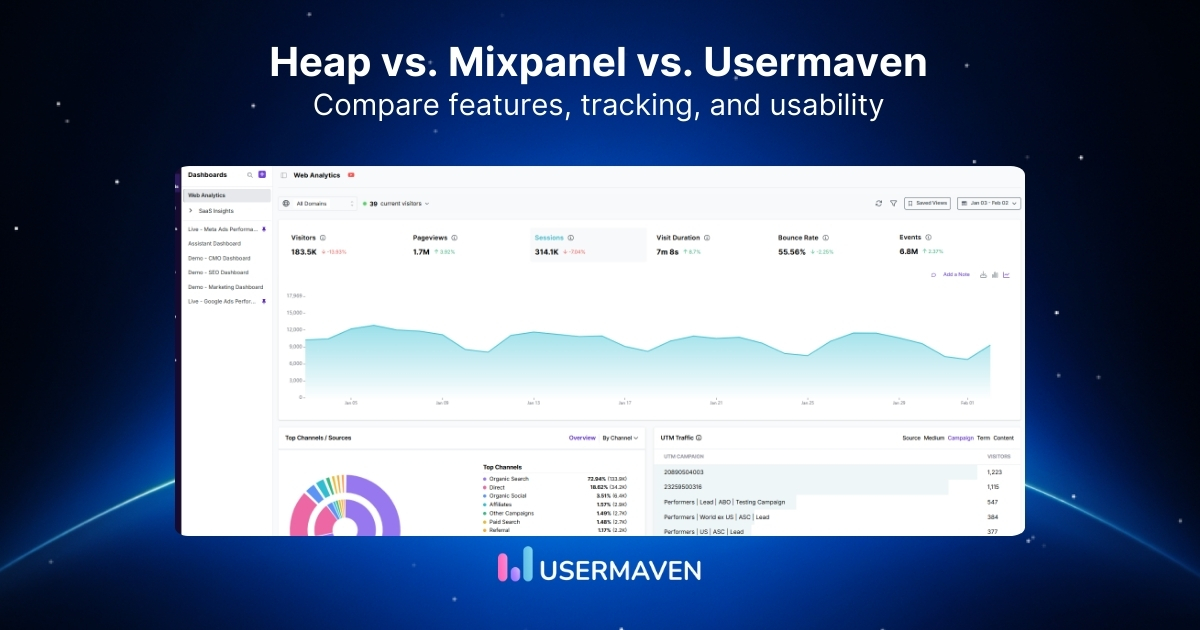
Heap vs. Mixpanel vs. Usermaven: A practical comparison
Data isn’t helpful if it’s too overwhelming or too complex. You need insights that are easy to act on and scalable to your needs. The challenge? Finding the tool that makes it easy to get there. The debate between Heap vs. Mixpanel vs. Usermaven is common, as each tool tackles data collection and analysis differently.…
-
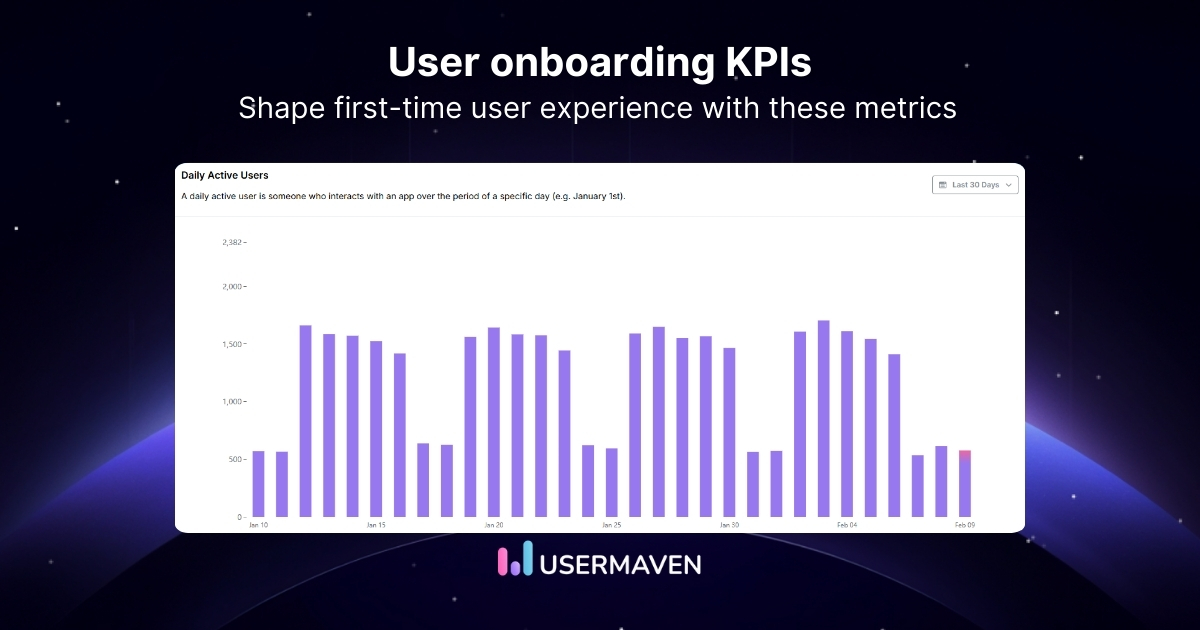
12 must-track user onboarding KPIs and metrics in 2026
Many teams invest time in onboarding flows but struggle to measure whether they actually work. Are users activating? Are they reaching value quickly? Or are they dropping off silently? User onboarding KPIs answer these questions. By tracking the right onboarding metrics, you can see how users experience your product during their first days and weeks. …
-
![Mixpanel vs. FullStory vs. Usermaven [2026 comparison]](https://blog.usermaven.com/wp-content/uploads/2026/02/Mixpanel-vs.-FullStory-vs.-Usermaven-.jpg)
Mixpanel vs. FullStory vs. Usermaven [2026 comparison]
Selecting the right analytics tool is important for optimizing your product analytics strategy. Each platform offers unique features that help track user behavior, measure key metrics, and improve overall performance. But which one aligns best with your needs? This guide will compare Mixpanel vs. FullStory vs. Usermaven, highlighting the key features, pricing, and benefits of…
-
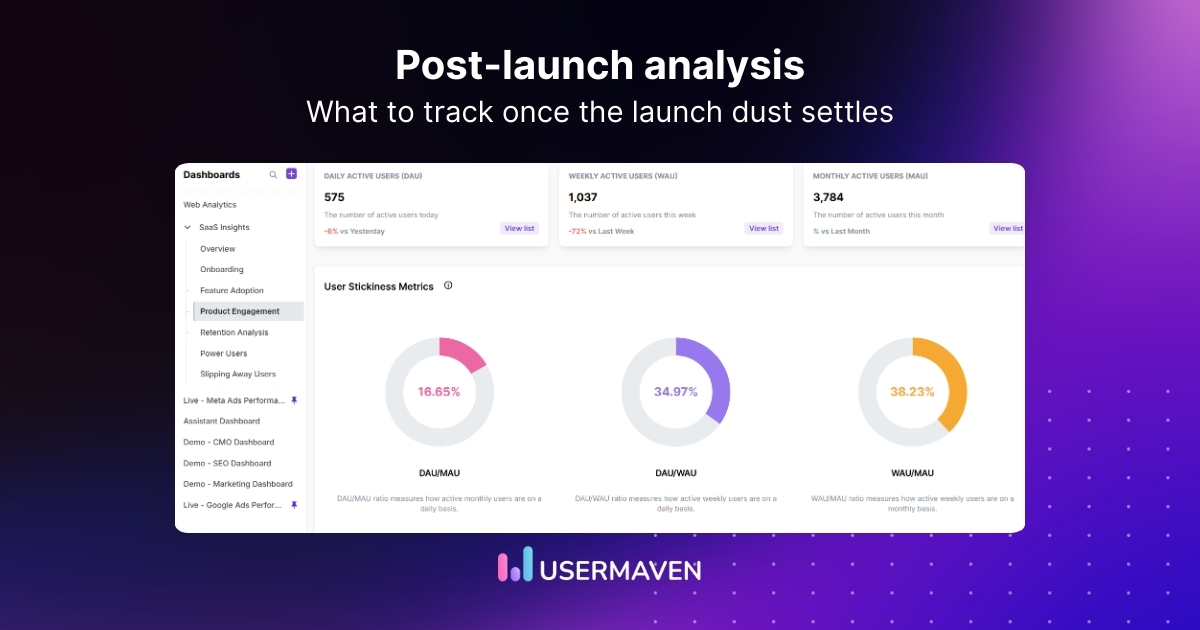
What happens after launch? A post-launch analysis guide
A launch does not end when the product goes live. The real insights appear once users start interacting, exploring features, and forming opinions. Post-launch analysis helps you understand these early signals and measure the true impact of your launch using product launch analytics. By reviewing performance, feedback, and user behavior together, post-launch analysis turns raw…
-
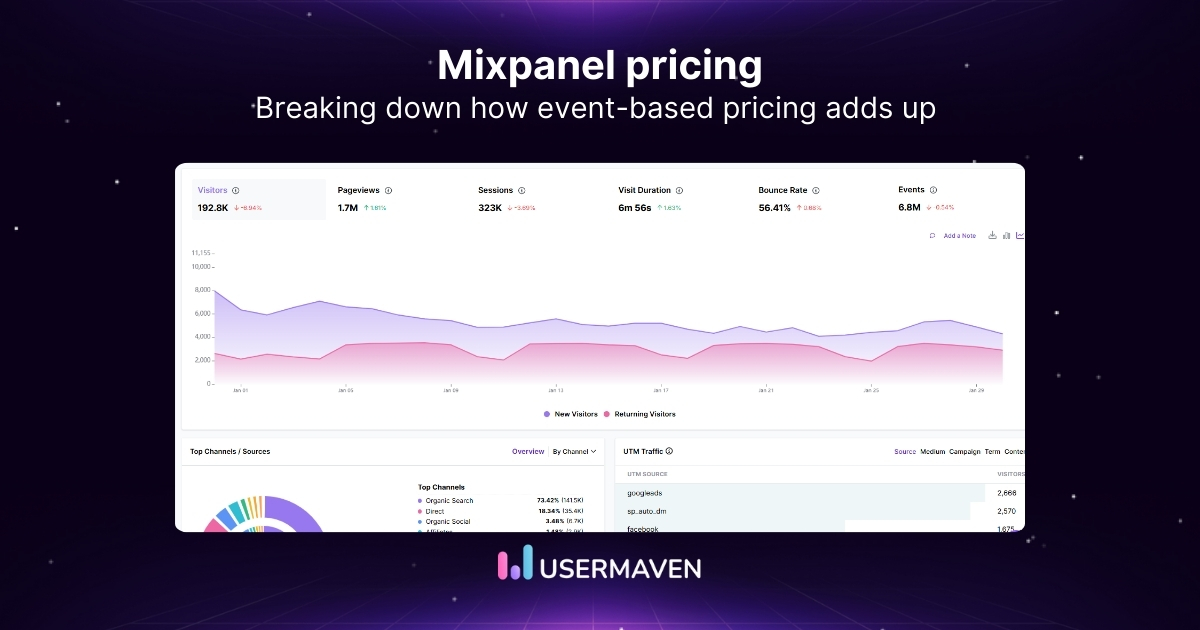
Mixpanel pricing explained (+ discover a better alternative)
Mixpanel is a popular choice for product analytics, and it’s easy to see why teams consider it early. Mixpanel pricing is based on event volume, so what you pay depends on how much you track and how your product usage grows over time. On the pricing page, the tiers can look straightforward at first glance.…
-
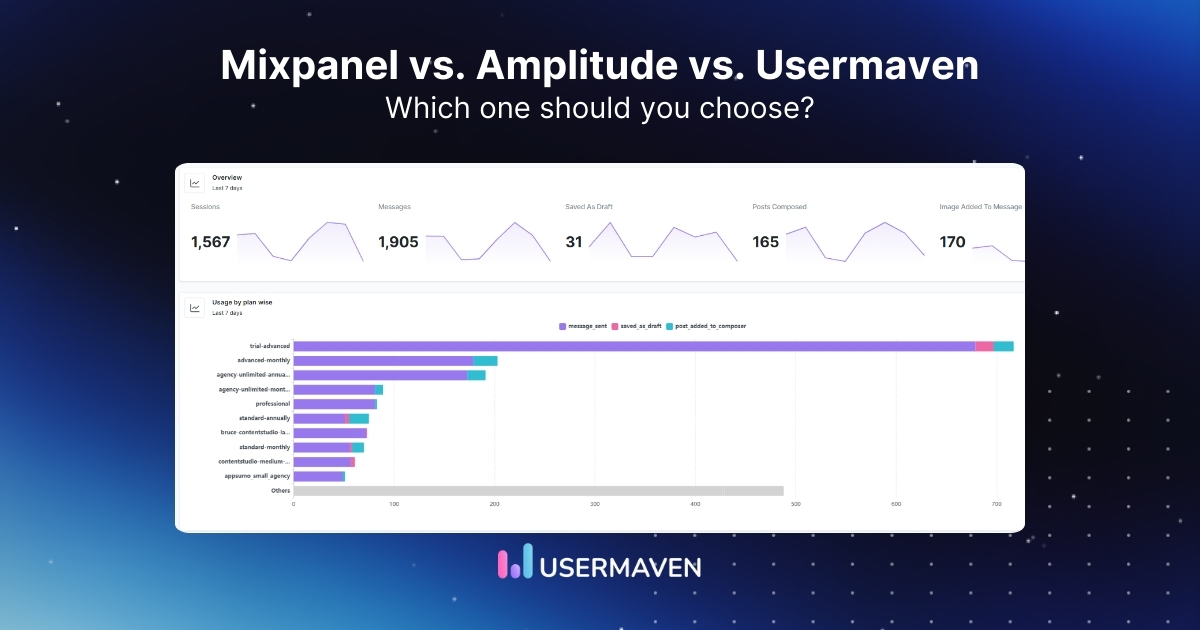
Which analytics platform wins? Mixpanel vs. Amplitude vs. Usermaven
Choosing analytics used to feel simple. Pick a tool, add tracking, and expect clean answers. Now, expectations are sharper. Marketing teams need marketing attribution that holds up when budget decisions are on the line. Product teams want real-time behavior, not delayed reports. And across the board, privacy compliance is no longer optional. That’s why the…
-
![Amplitude pricing: Worth it or not? [Discover Usermaven as an alternative]](https://blog.usermaven.com/wp-content/uploads/2024/11/Amplitude-pricing-1.jpg)
Amplitude pricing: Worth it or not? [Discover Usermaven as an alternative]
If you’ve been looking into Amplitude, you’ve likely come across its wide range of features, but also the steep price tag that comes with it. With Amplitude pricing evolving year after year, it can feel like the costs keep climbing, especially for businesses with growing user bases. So, before you pull out your wallet, let’s…
-
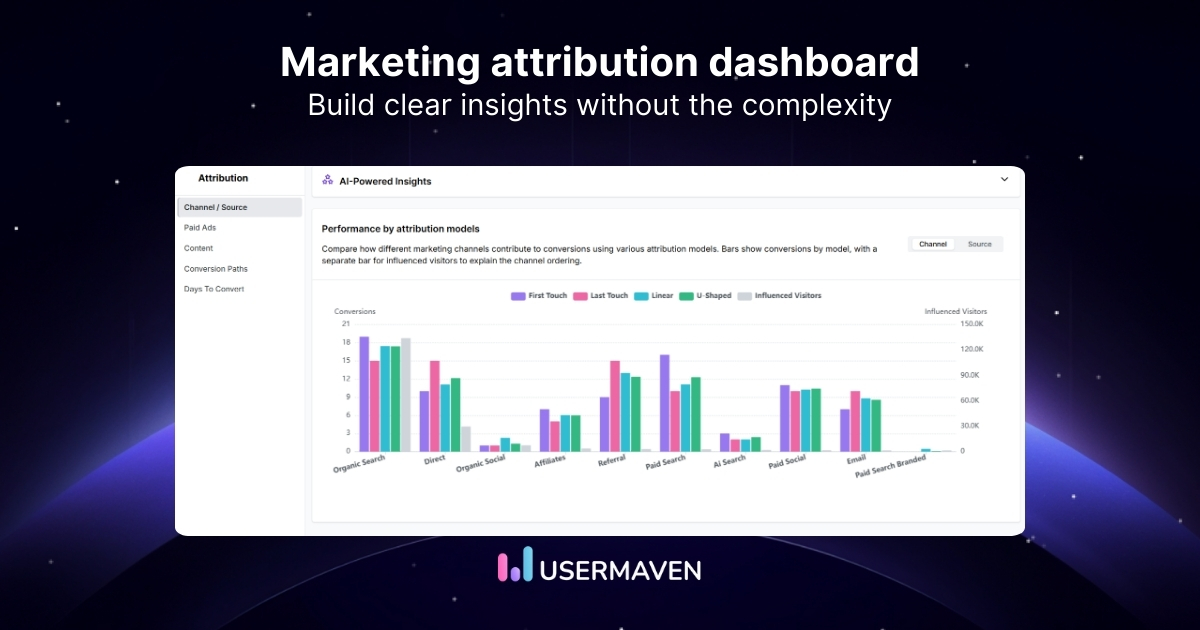
How to build a marketing attribution dashboard (without the usual headaches)
Building a marketing attribution dashboard sounds straightforward – until you actually try to do it. You start with the best intentions: track your campaigns, measure conversions, and finally understand what’s driving revenue. But then come the headaches, disconnected data, limited attribution models, developer dependencies, privacy concerns, and dashboards that are either too basic or overwhelmingly…
-
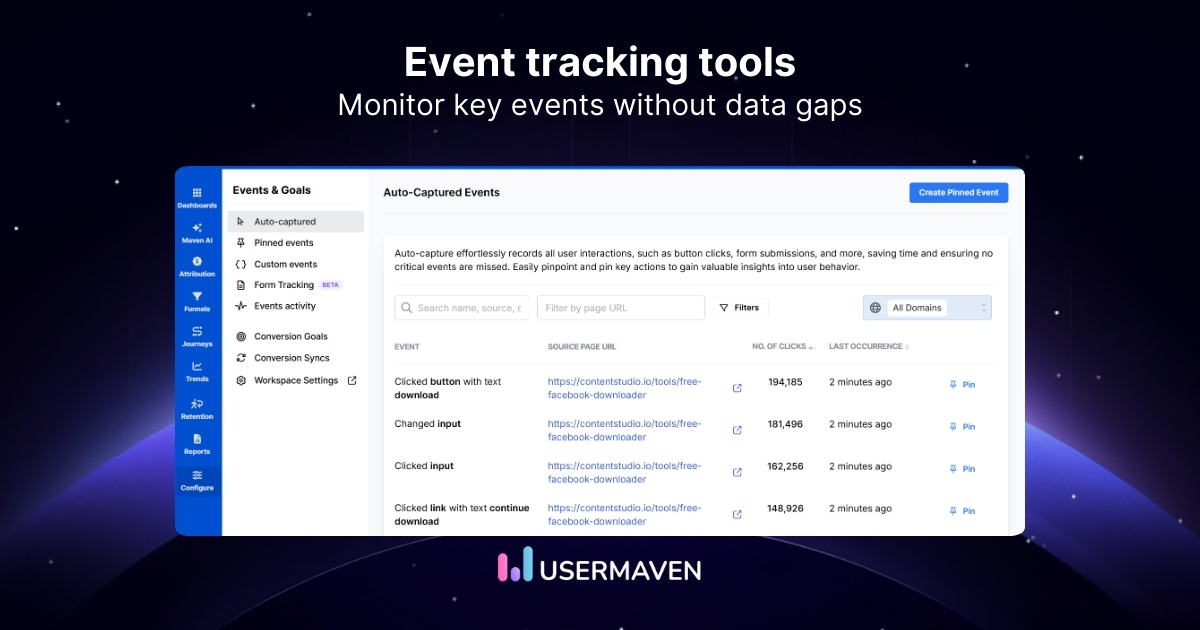
10 best event tracking tools for SaaS and websites
Every successful SaaS product understands user behavior at the action level. Event tracking tools make this possible by capturing how users interact with features, flows, and key moments across the product. With so many event analytics tools available, the difference often comes down to how quickly you can get reliable data and how easily teams…
-
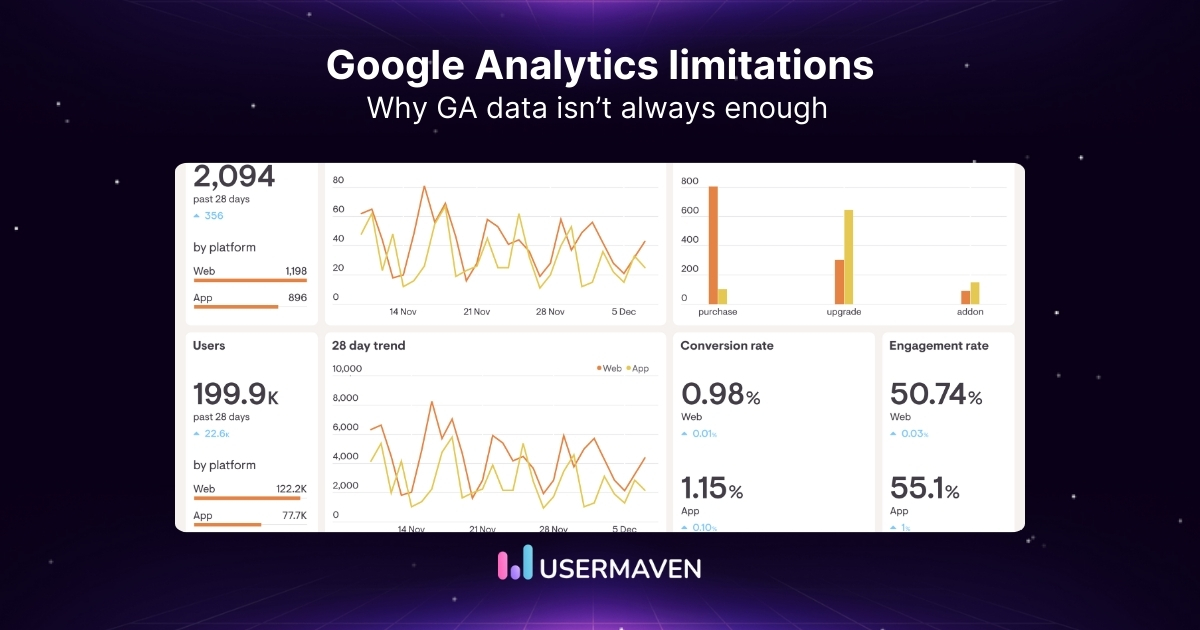
13 Google Analytics limitations you should be aware of
Starting July 1st, 2023, Universal Analytics (UA) stopped processing hits, including standard properties in accounts containing 360 properties. Businesses that use UA are left with no option other than migrating to an alternate analytics solution. While Google came up with a more advanced version of UA, called Google Analytics 4 (GA4), to replace it, the…