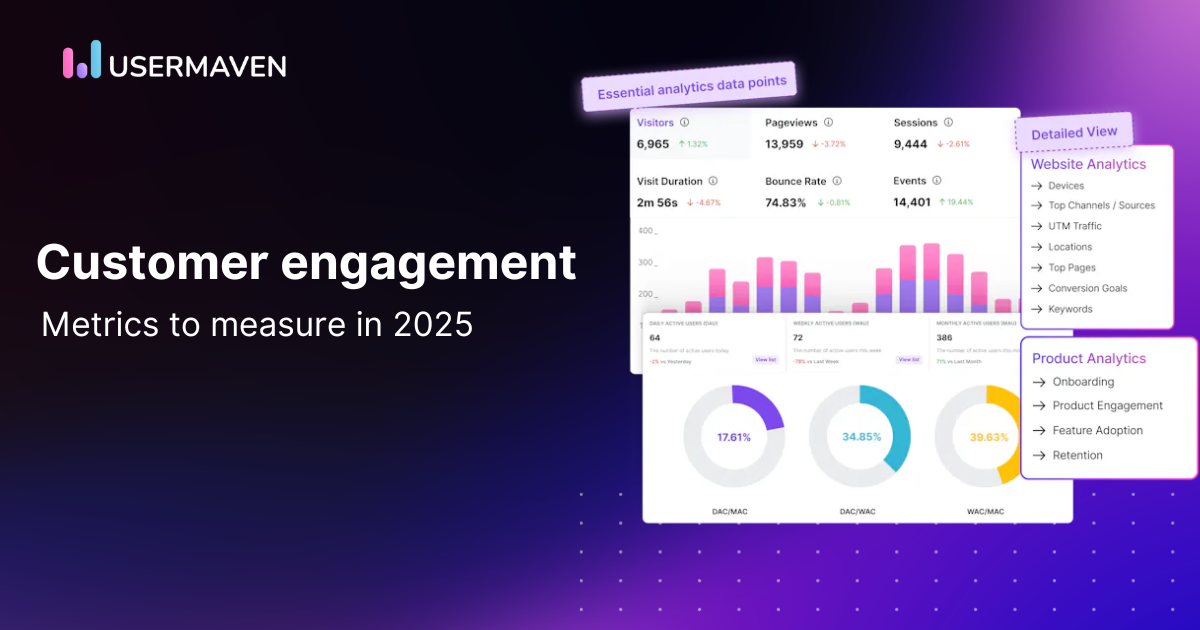
Customer engagement is one of those things that sounds simple – but actually isn’t. It’s not just about tracking clicks or how long someone stays on your site. It’s about understanding how people genuinely connect with your brand, your product, and everything in between.
Heading into 2026, measuring customer engagement metrics means looking at the bigger picture. You want to know how users are experiencing your business from the very first interaction to when (and if) they convert, and beyond.
The challenge? For many businesses, customer data lives in too many different places. That makes it hard to get a clear view of what’s really working and what’s not.
That’s where Usermaven comes in. It brings all your customer data together so you can see the full journey in one place – making it easier to spot trends, gaps, and opportunities to improve engagement.
In this article, we’ll break down 10 key customer engagement metrics worth paying attention to in 2026. We’ll talk about what they mean, why they matter, and how to actually put them to use.
Why customer engagement metrics matter
Customer engagement metrics give you the concrete data needed to make smart business decisions. When you can measure how customers interact with your digital platforms, you gain insights that impact every part of your business:
- Better products
- More effective marketing
- Stronger customer relationships
Companies that use data to understand customer behavior can respond more effectively to changing needs and preferences. This leads to better products, more effective marketing, and stronger customer relationships.
Looking at metrics like average session duration or social media engagement shows you exactly which touchpoints resonate most with your audience. This knowledge allows you to create more personalized experiences where customers feel understood and valued. As a result, businesses typically see higher conversion rates, increased customer lifetime value, and lower churn rates.
Data-backed insights remove guesswork from your strategy. You can clearly see what’s working and what needs improvement when you break down the customer journey into measurable components. For example, if your feature adoption rate is low, you know exactly where to focus improvement efforts.
How do these metrics actually translate to business results for your company?
10 important customer engagement metrics to measure
Tracking the right customer engagement metrics isn’t just about collecting data – it’s about uncovering what truly drives customer loyalty, satisfaction, and growth. When you know what to measure and why, you can focus your efforts where they’ll have the most impact. Whether you’re improving conversion rates, boosting retention, or understanding user behavior, these metrics will give you the clarity you need to make smarter decisions.
1. Usermaven’s AI-powered funnels
Usermaven’s AI-powered funnels is one of the customer engagement metrics that give you a complete view of your customer journey from first visit to conversion. Unlike basic analytics that just show you page views, these intelligent funnels identify exactly where users drop off and why. The AI analyzes patterns across thousands of user sessions to spot conversion barriers you might otherwise miss.
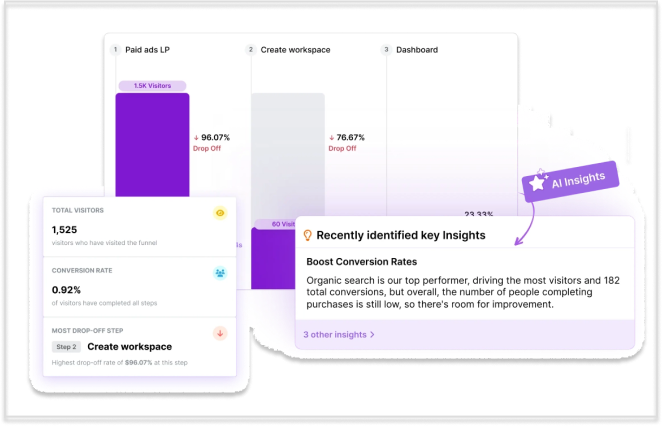
With these insights, you can make targeted improvements to each stage of your funnel. For example, if the AI identifies that mobile users drop off at your checkout page more frequently than desktop users, you can prioritize optimizing that specific experience. By removing friction at key touchpoints, businesses can significantly improve user flow and conversion potential.
The system automatically updates in real-time, so you can immediately see the impact of your changes. This allows for rapid testing and optimization without waiting for weekly or monthly reports. Teams can collaborate more effectively when everyone has access to the same clear, visual representation of the customer journey.
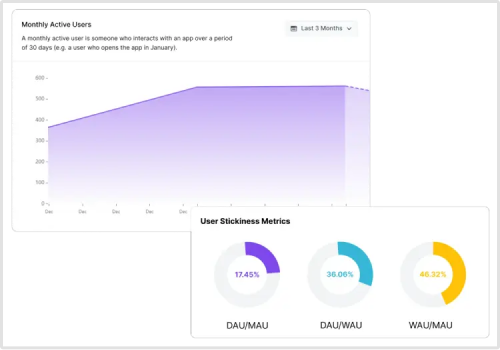
2. Website & app engagement: Average session duration
Average session duration is among the customer engagement metrics that measure how long users spend on your website or app during a single visit. This metric directly reflects how engaging your content and features are to your audience. When users spend more time with your product, they’re more likely to find value and eventually convert.
Related: Importance of engagement rate
The benchmark for a good session duration varies by industry. For content sites, 2-3 minutes might indicate strong engagement, while for SaaS products, 5-10 minutes could suggest users are actively exploring features. By comparing session durations across different user segments, you can identify which groups find your product most valuable.
For example, if new users spend an average of 45 seconds on your site while returning visitors average 4 minutes, you might need to improve your onboarding experience. Usermaven helps you track these patterns by automatically segmenting users and highlighting significant differences in engagement metrics.
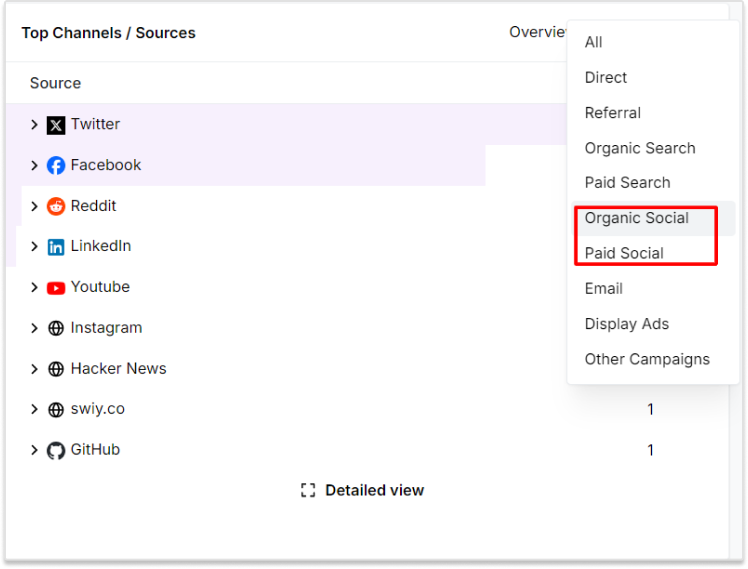
3. Social media engagement rate
Social media engagement rate measures how much interaction your content receives compared to your follower count. This includes likes, comments, shares, and other actions that show users are actively responding to your brand. A high engagement rate means your content resonates with your audience and encourages them to take action.
Calculate this metric by dividing total engagements by total followers, then multiplying by 100 to get a percentage. Most businesses aim for an engagement rate between 1-5%, though top-performing brands in some industries reach 10% or higher. Tracking engagement rates across different platforms helps you understand where your audience is most active and responsive.
When you notice certain posts generating significantly higher engagement, analyze what made them successful. Was it the format, topic, timing, or something else? Usermaven can help connect these social engagement metrics with website behavior to show you how social interactions translate to meaningful business outcomes.
4. Customer retention rate
Customer retention rate shows what percentage of your customers continue doing business with you over a specified period. This crucial metric directly impacts your bottom line since acquiring new customers typically costs 5-25 times more than retaining existing ones. A high retention rate indicates your product delivers ongoing value and meets customer expectations.
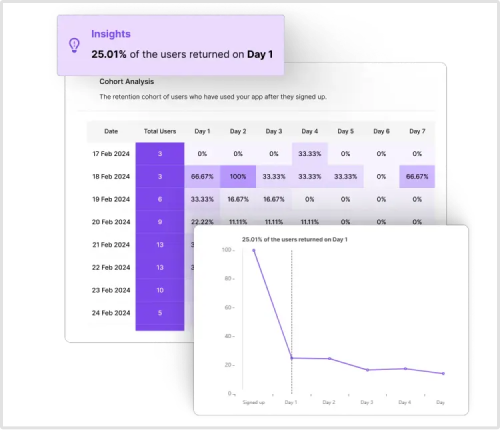
To calculate retention rate, take the number of customers at the end of a period, subtract any new customers gained during that period, divide by the number of customers at the start of the period, and multiply by 100. For SaaS companies, a good monthly retention rate is generally above 90%, while annual retention rates above 80% are considered strong.
| Metric | Calculation formula | Example |
| Retention rate | ((End customers – new customers) ÷ start customers) × 100 | ((950 – 200) ÷ 1000) × 100 = 75% |
Monitoring changes in retention rate helps you identify potential problems before they become serious. If you notice retention dropping among certain customer segments, you can take action before they churn. Usermaven helps by alerting you to significant changes in retention patterns and identifying which customer segments are most at risk.
Related: Customer engagement analytics: A complete guide
5. Net promoter score (NPS)
Net Promoter Score measures how likely your customers are to recommend your product or service to others. This simple metric gives you powerful insights into customer loyalty and satisfaction. Customers respond to a single question: “On a scale of 0-10, how likely are you to recommend our product to a friend or colleague?”
Based on their answers, customers fall into three categories: Promoters (9-10), Passives (7-8), and Detractors (0-6). To calculate your NPS, subtract the percentage of Detractors from the percentage of Promoters. Scores range from -100 to +100, with anything above 0 considered good and above 50 excellent.
| NPS category | Score range | Typical characteristics |
| Promoters | 9-10 | 70% higher retention, spend 15-30% more |
| Passives | 7-8 | Satisfied but not enthusiastic, vulnerable to competitors |
| Detractors | 0-6 | Unhappy customers, potential source of negative word-of-mouth |
What makes NPS particularly valuable is its predictive power. Customers who score as Promoters typically have a 70% higher retention rate and spend 15-30% more than other customers.
6. Customer lifetime value (CLV)
Customer Lifetime Value estimates the total revenue a customer will generate throughout their relationship with your business. This forward-looking metric helps you make smart decisions about how much to invest in customer acquisition and retention strategies. Knowing your CLV allows you to allocate resources efficiently and focus on the most valuable customer segments.
Calculate a basic CLV by multiplying the average purchase value by the average purchase frequency and the average customer lifespan. More advanced models account for changing purchase patterns and discount rates. For most businesses, increasing CLV by just 5% can boost profits by 25-95%, making it one of the most impactful metrics to improve.

Usermaven helps you track CLV across different customer segments and identify factors that correlate with higher lifetime value. This allows you to develop targeted strategies to increase CLV, such as cross-selling complementary products or creating loyalty programs for high-value segments.
7. Conversion rate
Conversion rate measures the percentage of visitors who complete a desired action on your website or app. These actions could include making a purchase, signing up for a trial, downloading content, or any other goal that moves users closer to becoming customers. Higher conversion rates mean your marketing and product experience effectively persuade users to take action.

Calculate this rate by dividing the number of conversions by the total number of visitors and multiplying by 100. Average conversion rates vary widely by industry and conversion type, but for e-commerce, 2-5% is typical, while B2B lead generation might see 3-10% for form submissions.
| Metric | Calculation formula | Example |
| Conversion rate | (Conversions ÷ total visitors) × 100 | (50 purchases ÷ 1000 visitors) × 100 = 5% |
The most valuable aspect of conversion rate analysis is comparing rates across different traffic sources, devices, and user segments. This shows you exactly where to focus optimization efforts. Usermaven’s analytics make these comparisons simple with automatic tracking of conversion events and intuitive visualization of conversion funnels.
8. Feature adoption rate
Feature adoption rate tracks what percentage of your users actively use specific features in your product. This metric helps product teams understand which features deliver value and which ones users ignore. Low adoption of important features often indicates usability issues or poor communication about feature benefits.
Related: A guide to feature usage analysis
Calculate this by dividing the number of users who have used a feature by your total number of active users. For core features, you typically want adoption rates above 60%, while for secondary features, 20-40% might be acceptable depending on your product. Tracking adoption over time shows whether your efforts to promote features are working.
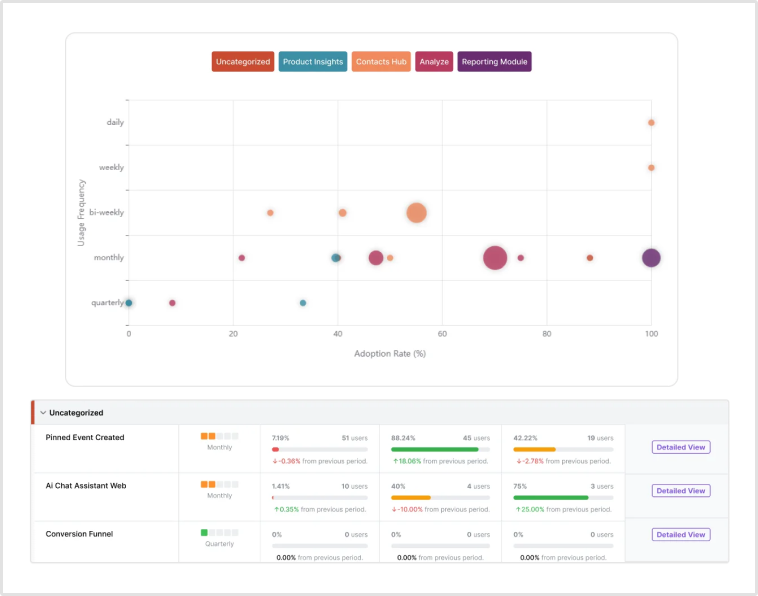
Usermaven automatically monitors feature usage and alerts you when adoption differs significantly from your targets. This allows you to quickly identify features that need improvement or better promotion. You can segment users based on feature adoption to understand what distinguishes power users from casual ones.
9. Customer satisfaction score (CSAT)
Customer Satisfaction Score gives you immediate feedback on how happy customers are with specific interactions or overall experience. Typically measured through post-interaction surveys, CSAT asks customers to rate their satisfaction on a scale (often 1-5 or 1-10). This direct feedback highlights both strengths and problems in your customer experience.
Calculate your CSAT by dividing the number of satisfied customers (those who selected 4 or 5 on a 5-point scale) by the total number of respondents, then multiplying by 100. A score above 80% is generally considered good, while top-performing companies aim for 90%+.
The main advantage of CSAT is its simplicity and immediacy. Unlike metrics that take time to change, CSAT gives you instant feedback on recent changes to your product or service. Usermaven helps you collect CSAT data at key touchpoints and analyze it alongside behavioral metrics to get a complete picture of customer experience.
10. Churn rate
Churn rate calculates what percentage of your customers stop using your product during a specific period. This metric serves as an early warning system for customer dissatisfaction and directly impacts your revenue and growth potential. Every percentage point reduction in churn can significantly boost your company’s valuation and long-term success.
Calculate churn by dividing the number of customers lost during a period by the number you had at the beginning of that period, then multiply by 100. For SaaS businesses, monthly churn rates below 5% are typically considered acceptable, while the best performers maintain rates under 3%.
| Metric | Calculation formula | Example |
| Churn rate | (Lost customers ÷ starting customers) × 100 | (30 churned ÷ 500 customers) × 100 = 6% |
Understanding why customers churn is just as important as tracking the rate itself. Usermaven helps identify common behaviors that precede churn, allowing you to intervene before customers leave. The platform also segments churned customers based on their usage patterns, helping you develop targeted retention strategies for at-risk segments.
How to leverage customer engagement metrics with Usermaven
Usermaven makes it easy to track and act on all the customer engagement metrics we’ve discussed. The platform’s real-time dashboards give you immediate visibility into how users interact with your business across all touchpoints. Unlike complex analytics tools that require technical expertise, Usermaven’s intuitive interface makes advanced insights accessible to everyone on your team.
Usermaven’s key features include:
- Real-time dashboards (Pre-built and Custom)
- Automatic event tracking
- Advanced segmentation capabilities
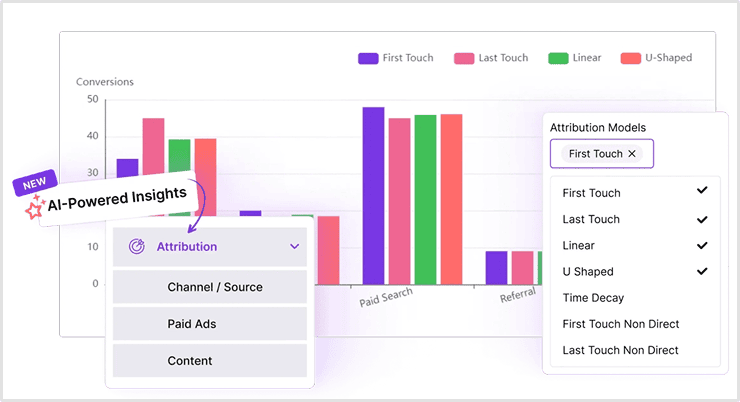
- AI-powered attribution models
- Automated reporting

One of Usermaven’s standout features is automatic event tracking. This means you don’t need to write code to capture important user actions. The system automatically identifies significant events like button clicks, form submissions, and page views, saving your development team valuable time. For marketing teams, this makes it possible to analyze customer journeys without constantly requesting help from developers.
Usermaven’s segmentation capabilities allow you to slice your data by user demographics, behavior patterns, or acquisition channels. For example, product managers can use feature adoption metrics to see which user segments are most actively engaging with new features. Marketing teams can compare conversion rates across different campaigns to optimize their spending. Customer success teams can identify accounts showing signs of potential churn before it happens.
The AI-powered attribution models in Usermaven connect marketing efforts directly to product usage and revenue. This gives you clear visibility into which channels and campaigns drive not just traffic, but actual engaged users who convert and stay. With these insights, you can make data-driven decisions about where to invest your marketing budget for maximum impact on customer engagement and retention.
Usermaven’s automated reporting saves hours of manual work each week. Schedule reports to be delivered to key stakeholders with the exact metrics they need to see. Custom dashboards can be created for different teams, ensuring everyone has the relevant information without getting overwhelmed by data they don’t need.
Conclusion
Customer engagement metrics are no longer just nice-to-have – they’re essential tools for business growth in 2026. The companies that thrive will be those that effectively measure, understand, and improve how customers interact with their products and brand.
By focusing on the ten metrics we’ve explored – from AI-powered funnels to churn rate – you’ll gain a comprehensive view of your customer experience. Each metric offers unique insights that, when combined, create a roadmap for sustainable growth.
Usermaven simplifies this process by bringing all your engagement data together in one intuitive platform. Without complex setup or coding requirements, you can start tracking these critical metrics and turning insights into action immediately.
Power up your SaaS
with perfect product analytics
*No credit card required
FAQs about customer engagement metrics
1. What is the difference between customer engagement and user engagement?
Customer engagement typically includes broader relationship-building efforts across the entire customer lifecycle, while user engagement often focuses on in-product behaviors and usage patterns.
2. Why is customer engagement important for SaaS companies?
High engagement leads to better retention, higher lifetime value, and more referrals – key growth levers in subscription-based models.
3. How often should I track engagement metrics?
Ideally, engagement metrics should be monitored continuously with weekly or monthly reviews to spot trends and respond quickly.
4. What’s the best way to measure feature adoption?
Use product analytics tools like Usermaven to track how many active users interact with specific features over time and identify drop-off points.
5. How do AI-powered funnels help with customer engagement?
They automatically analyze user behavior, highlight where drop-offs occur, and offer actionable insights to improve the customer journey.
6. What’s a good NPS score in 2026?
Anything above 0 is good, above 50 is excellent, and top-performing companies often aim for 70+.
7. How does session duration relate to customer satisfaction?
Longer session durations often indicate higher engagement and satisfaction, but context matters – short sessions could also mean users found what they needed quickly.
8. Which metric should I prioritize if I’m just starting?
Start with retention rate and conversion rate. They give a quick view of how well you’re attracting and keeping users.
9. Can I improve CLV without changing my pricing?
Yes. Focus on increasing retention, cross-selling, upselling, and improving customer experience to drive more value over time.
10. How is CSAT different from NPS?
CSAT measures immediate satisfaction with a specific interaction, while NPS gauges long-term loyalty and the likelihood of recommending your brand.
11. What causes high churn, and how can I reduce it?
Common causes include poor onboarding, unmet expectations, and lack of ongoing value. Reducing churn requires proactive engagement and feature adoption strategies.
12. Can Usermaven replace my other analytics tools?
Usermaven offers a unified view of product and marketing analytics, making it a strong alternative to multiple fragmented tools.